Unlock a world of possibilities! Login now and discover the exclusive benefits awaiting you.
- Qlik Community
- :
- All Forums
- :
- QlikView App Dev
- :
- Limit the X-Axis in a Gant chart
- Subscribe to RSS Feed
- Mark Topic as New
- Mark Topic as Read
- Float this Topic for Current User
- Bookmark
- Subscribe
- Mute
- Printer Friendly Page
- Mark as New
- Bookmark
- Subscribe
- Mute
- Subscribe to RSS Feed
- Permalink
- Report Inappropriate Content
Limit the X-Axis in a Gant chart
I have read through the forums to try to fins a solution for my problem but haven't succeeded so far.
I have created a Gant chart based on the data how different jobs run on a server. My problem is that I want to have the history available which obviously makes the X-Axies to display three years of data which I haven't succeeded in limiting.
The data consists
Name Type StartTime CompleteTime
and the result looks like this.
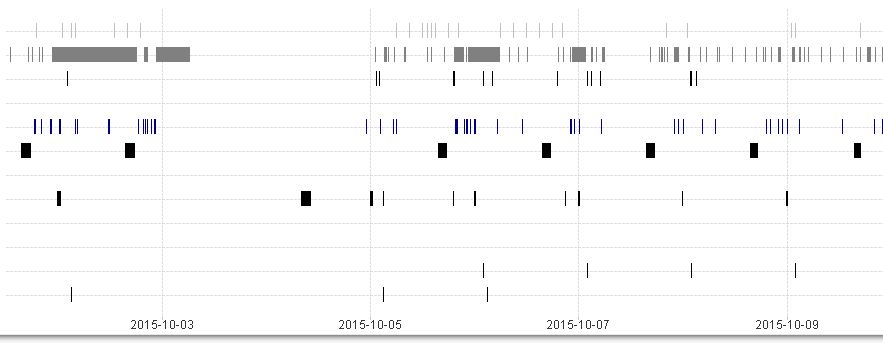
I want to have a scroll bar on the X-axis and limit the visible part to e.g. 1 month, but haven't been able to figure out how,
any help would be appreciated. In the picture above do I only have a limited number of data available so therefor do the bars look ok, but if I import a larger period will qlikview shov everything in the same window.
- Tags:
- gant
- scrollable
- x-axis