Unlock a world of possibilities! Login now and discover the exclusive benefits awaiting you.
- Qlik Community
- :
- All Forums
- :
- QlikView App Dev
- :
- Re: Limit values from a graph
- Subscribe to RSS Feed
- Mark Topic as New
- Mark Topic as Read
- Float this Topic for Current User
- Bookmark
- Subscribe
- Mute
- Printer Friendly Page
- Mark as New
- Bookmark
- Subscribe
- Mute
- Subscribe to RSS Feed
- Permalink
- Report Inappropriate Content
Limit values from a graph
Hi
I have a graph and i wanna limit the values to the top 5 or top 7 or the 'x' value that i wanna see
i did an inline table like this
VALOR_LIMITE:
LOAD * INLINE [
VALOR_LIMITE,
5,
8,
12,
15
];
and in the dimension limits i use this field, but it isn´t working
what do you suggest?
Regards
- Tags:
- new_to_qlikview
- « Previous Replies
- Next Replies »
- Mark as New
- Bookmark
- Subscribe
- Mute
- Subscribe to RSS Feed
- Permalink
- Report Inappropriate Content
Jeremias,
Correct me if i'm wrong, as your field have multiple values which value are you passing to dimension limits to limit ?
use a variable, on selection of value pass the selected value into variable & use that variable in dimension limits, by using variable u can choose an option to feed it data from input fields too.
Hope this helps.
thanks
Brad.
- Mark as New
- Bookmark
- Subscribe
- Mute
- Subscribe to RSS Feed
- Permalink
- Report Inappropriate Content
Open a new script and enter:
DummyData:
Load
RowNo() as SalesKey,
RowNo() * 3 as OrderAmount
AutoGenerate(50);
VALOR_LIMITE:
LOAD * INLINE [
VALOR_LIMITE,
5,
8,
12,
15
];
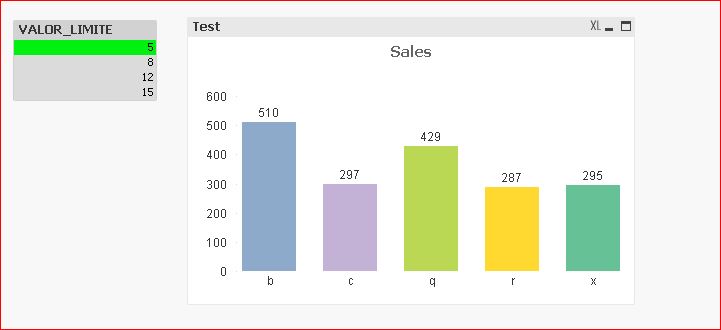
1. Make a bar chart with SalesKey as the dimension and sum (OrderAmount) as the expression.
2. Add a Slider/Calendar Object. Set the Input Style to Slider, make sure Field is selected under Data, and select VALOR_LIMITE to its right. Make sure Discrete is checked in the Value Mode section.
3. Open up the properties for the new chart and go to the Dimension Limits tab. Make sure SalesKey is selected on the right, check "Restrict which values are displayed using the first expression," then select Show only. Select Largest, and then in the box to its right enter "=GetFieldSelections(VALOR_LIMITE)".
The slider now controls the number of values included in the chart. Note the 8 bars in the image below. The slider is restricted to the values entered in the script.
- Mark as New
- Bookmark
- Subscribe
- Mute
- Subscribe to RSS Feed
- Permalink
- Report Inappropriate Content
Hi,
Do you want the Graph based on your Selection in the VALOR_LIMITE? Like this..
try to put the below expression in your Dimension limit..
=if(isnull(GetFieldSelections(VALOR_LIMITE)),Count(Dim),GetFieldSelections(VALOR_LIMITE))
- Mark as New
- Bookmark
- Subscribe
- Mute
- Subscribe to RSS Feed
- Permalink
- Report Inappropriate Content
To prevent a user from selecting more than one value in the VALOR_LIMITE list box, select one value and then open the List Box properties. In the General tab check Always one selected value.
You may want to set a trigger on open to select a default value since reloads will sometimes deselect all options.
- Mark as New
- Bookmark
- Subscribe
- Mute
- Subscribe to RSS Feed
- Permalink
- Report Inappropriate Content
hi,
Instead its very easy to use a variable with input box ,
1)Create a Variable vLimit and assign a values 0
2) Take one input box and add this variable to it
3) Open Chart --> properties --> Dimension Limits --> select largest --> erase default values use this variable $(vLimit)
and Un check others
4) Give the value in input box then Chart display will change according to your selections
- Mark as New
- Bookmark
- Subscribe
- Mute
- Subscribe to RSS Feed
- Permalink
- Report Inappropriate Content
Hi,
Try like this in Dimension Limits
Chart Propeties -> Dimension Limits -> Select Show Only -> Largest 5 Values.
Hope this helps you.
Regards,
Jagan.
- Mark as New
- Bookmark
- Subscribe
- Mute
- Subscribe to RSS Feed
- Permalink
- Report Inappropriate Content
Hey
Thanks for the example
Can i use a ciclic dimension ?
- Mark as New
- Bookmark
- Subscribe
- Mute
- Subscribe to RSS Feed
- Permalink
- Report Inappropriate Content
Hey
Thank you for your answer
Can i use a cyclic dimension with this?
I tried using "" and '' but i couldn´t make it work
Regards
- Mark as New
- Bookmark
- Subscribe
- Mute
- Subscribe to RSS Feed
- Permalink
- Report Inappropriate Content
You can use it. You need to use Getcurrentfield (Your group name )
- « Previous Replies
- Next Replies »