Unlock a world of possibilities! Login now and discover the exclusive benefits awaiting you.
- Qlik Community
- :
- All Forums
- :
- QlikView App Dev
- :
- Limiting data displayed in bar chart to last 12 ye...
- Subscribe to RSS Feed
- Mark Topic as New
- Mark Topic as Read
- Float this Topic for Current User
- Bookmark
- Subscribe
- Mute
- Printer Friendly Page
- Mark as New
- Bookmark
- Subscribe
- Mute
- Subscribe to RSS Feed
- Permalink
- Report Inappropriate Content
Limiting data displayed in bar chart to last 12 years
I have data spanning some years as follows:
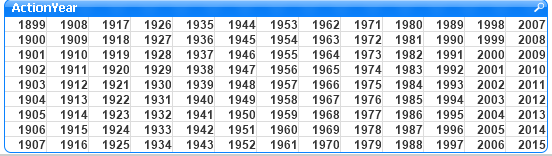
I have generated the following bar chart with ActionYear (Approval Year) as dimension and with the following expression:
if(Rank(Count({$<ChemicalTypeCode={1}>} DISTINCT [FDA Trade Name])) <= 12, Count({$<ChemicalTypeCode={1}>} Distinct [FDA Trade Name]))
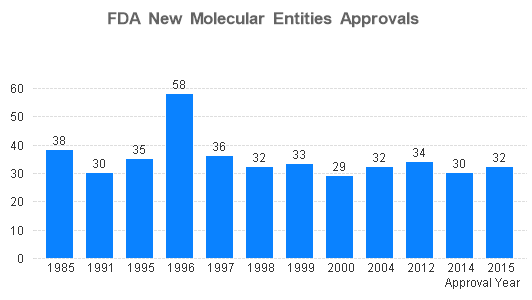
I had hoped to display the last 12 years only but my expression is taking the top 12. How can i show the data for the last 12 years only?
Regards.
- « Previous Replies
-
- 1
- 2
- Next Replies »
Accepted Solutions
- Mark as New
- Bookmark
- Subscribe
- Mute
- Subscribe to RSS Feed
- Permalink
- Report Inappropriate Content
Try with the same expression:
if(Rank(Count({$<ChemicalTypeCode={1}>} DISTINCT [FDA Trade Name])) <= 12, Count({$<ChemicalTypeCode={1}>}Distinct [FDA Trade Name]))
BUT ! Add a "Calculated Dimension" and use this expression:
if ( ActionYear > year(today) - 12 , ActionYear )
In this way you have a dynamic solution! I think so!
- Mark as New
- Bookmark
- Subscribe
- Mute
- Subscribe to RSS Feed
- Permalink
- Report Inappropriate Content
Try this:
If(ActionYear >= (Year(Today()) - 11), If(Rank(Count({$<ChemicalTypeCode={1}>} DISTINCT [FDA Trade Name])) <= 12, Count({$<ChemicalTypeCode={1}>}Distinct [FDA Trade Name])))
- Mark as New
- Bookmark
- Subscribe
- Mute
- Subscribe to RSS Feed
- Permalink
- Report Inappropriate Content
count({<[Approval Date]={"<=$(=max([Approval Date]))"}>} DISTINCT [FDA Trade Name])
-Rob
- Mark as New
- Bookmark
- Subscribe
- Mute
- Subscribe to RSS Feed
- Permalink
- Report Inappropriate Content
Hi Christopher Chitemerere, try with this:
if(Rank(Count({$<ChemicalTypeCode={1} , ActionYear={"2004" , "2005" , "2006" , "2007" , "2008" , "2009" , "2010" , "2011" , "2012" , "2013" , "2014" , "2015"}>} DISTINCT [FDA Trade Name])) <= 12, Count({$<ChemicalTypeCode={1} , ActionYear={"2004" , "2005" , "2006" , "2007" , "2008" , "2009" , "2010" , "2011" , "2012" , "2013" , "2014" , "2015"}>}Distinct [FDA Trade Name]))
I hope that it help you !
If not, you can do an extra dimension when you load your table.
For example:
LOAD
if(ActionYear >= 2004 , ActionYear ) as ActionYearSpecific
from [YOUR_TABLE];
then put like dimension in your chart: ActionYearSpecific
Regards!
- Mark as New
- Bookmark
- Subscribe
- Mute
- Subscribe to RSS Feed
- Permalink
- Report Inappropriate Content
Thanks Sunny, with your recommendations, i get the following:
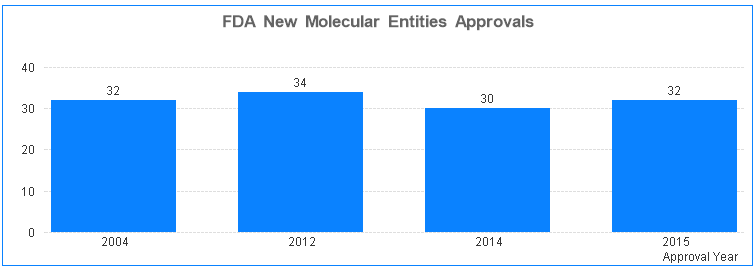
Regards
- Mark as New
- Bookmark
- Subscribe
- Mute
- Subscribe to RSS Feed
- Permalink
- Report Inappropriate Content
Isn't that what you wanted? Last 12 years -> 2004 - 2015?
- Mark as New
- Bookmark
- Subscribe
- Mute
- Subscribe to RSS Feed
- Permalink
- Report Inappropriate Content
Thanks Rob, i have a year field and not a date field.
Regards
- Mark as New
- Bookmark
- Subscribe
- Mute
- Subscribe to RSS Feed
- Permalink
- Report Inappropriate Content
Hi Sunny, yes i want las 12 years, using straight table analysis filtering with year and ChemicalTypeCode shows that values for the following years should be:
2013 - 25, 2012 - 34, 2011 - 24 , 2010 - 15, 2009 - 20, 2008 - 21, 2007 - 16, 2006 - 16, 2005 - 22
So we are missing these years in the displayed chart.
- Mark as New
- Bookmark
- Subscribe
- Mute
- Subscribe to RSS Feed
- Permalink
- Report Inappropriate Content
Hi Cristopher,
Please try this way:
Count({$<ChemicalTypeCode={1}, ActionYear={">$(=Year(Today())-12)"}>} Distinct [FDA Trade Name]))
Hope this helps.
Regards,
Sergio.
- Mark as New
- Bookmark
- Subscribe
- Mute
- Subscribe to RSS Feed
- Permalink
- Report Inappropriate Content
That has something to do with your other part of the expression. Do you have a sample that you can share?
- « Previous Replies
-
- 1
- 2
- Next Replies »