Unlock a world of possibilities! Login now and discover the exclusive benefits awaiting you.
- Qlik Community
- :
- All Forums
- :
- QlikView App Dev
- :
- Limiting data displayed in bar chart to last 12 ye...
- Subscribe to RSS Feed
- Mark Topic as New
- Mark Topic as Read
- Float this Topic for Current User
- Bookmark
- Subscribe
- Mute
- Printer Friendly Page
- Mark as New
- Bookmark
- Subscribe
- Mute
- Subscribe to RSS Feed
- Permalink
- Report Inappropriate Content
Limiting data displayed in bar chart to last 12 years
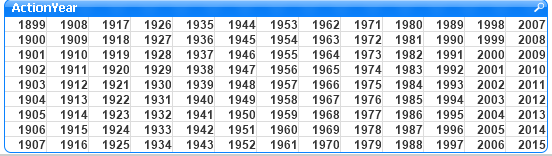
I have data spanning some years as follows:
I have generated the following bar chart with ActionYear (Approval Year) as dimension and with the following expression:
if(Rank(Count({$<ChemicalTypeCode={1}>} DISTINCT [FDA Trade Name])) <= 12, Count({$<ChemicalTypeCode={1}>} Distinct [FDA Trade Name]))
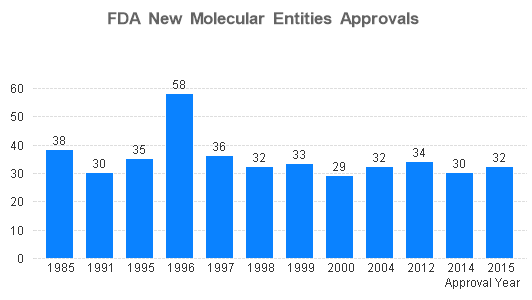
I had hoped to display the last 12 years only but my expression is taking the top 12. How can i show the data for the last 12 years only?
Regards.
- « Previous Replies
-
- 1
- 2
- Next Replies »
- Mark as New
- Bookmark
- Subscribe
- Mute
- Subscribe to RSS Feed
- Permalink
- Report Inappropriate Content
Thank you Agustin, the first recommendation works and i get what i am looking for. However i would have preferred this be dynamic as opposed to hard coded.
- Mark as New
- Bookmark
- Subscribe
- Mute
- Subscribe to RSS Feed
- Permalink
- Report Inappropriate Content
Hi Sunny, this is the only expression. Using Augustin's recommendation confirms what i had mentioned to you earlier on as follows:
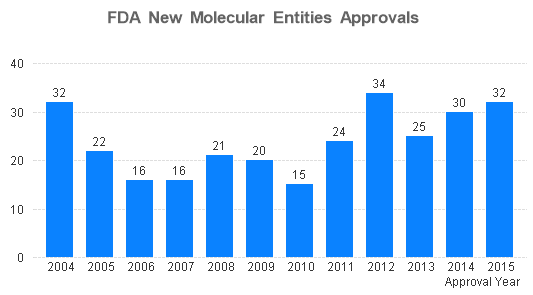
I was however looking of dynamic expression as opposed to a hard coded one. Let me send the sample application
- Mark as New
- Bookmark
- Subscribe
- Mute
- Subscribe to RSS Feed
- Permalink
- Report Inappropriate Content
Try with the same expression:
if(Rank(Count({$<ChemicalTypeCode={1}>} DISTINCT [FDA Trade Name])) <= 12, Count({$<ChemicalTypeCode={1}>}Distinct [FDA Trade Name]))
BUT ! Add a "Calculated Dimension" and use this expression:
if ( ActionYear > year(today) - 12 , ActionYear )
In this way you have a dynamic solution! I think so!
- Mark as New
- Bookmark
- Subscribe
- Mute
- Subscribe to RSS Feed
- Permalink
- Report Inappropriate Content
Hi Agustin, Many thanks, that works. I had to change the expression there were missing two brackets on today like today() :
if ( ActionYear > year(today()) - 12 , ActionYear )
- Mark as New
- Bookmark
- Subscribe
- Mute
- Subscribe to RSS Feed
- Permalink
- Report Inappropriate Content
Thank you Sergio, your recommendation also works well.
Regards
- Mark as New
- Bookmark
- Subscribe
- Mute
- Subscribe to RSS Feed
- Permalink
- Report Inappropriate Content
Alright, but this works  you're welcome !
best regards!
- « Previous Replies
-
- 1
- 2
- Next Replies »