Unlock a world of possibilities! Login now and discover the exclusive benefits awaiting you.
- Qlik Community
- :
- All Forums
- :
- QlikView App Dev
- :
- Re: Limiting data displayed in chart by date
- Subscribe to RSS Feed
- Mark Topic as New
- Mark Topic as Read
- Float this Topic for Current User
- Bookmark
- Subscribe
- Mute
- Printer Friendly Page
- Mark as New
- Bookmark
- Subscribe
- Mute
- Subscribe to RSS Feed
- Permalink
- Report Inappropriate Content
Limiting data displayed in chart by date
Hello community members,
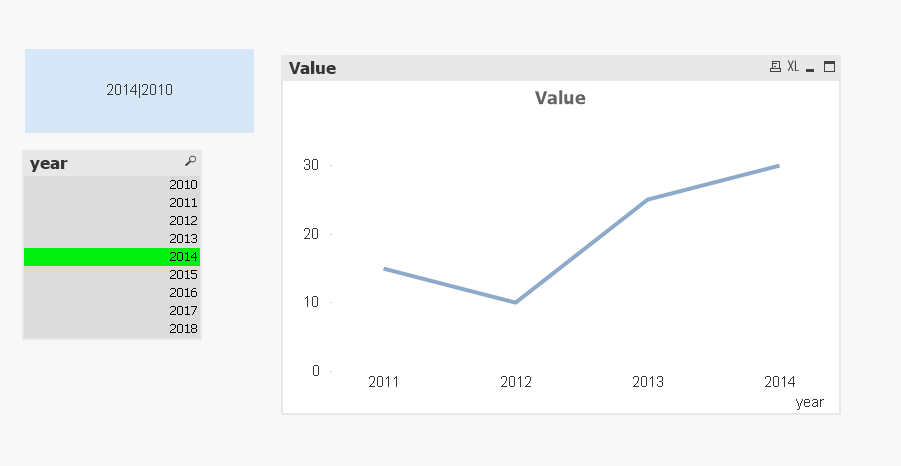
I have a line chart in which I'm trying to display totals year-by-year, for each of the previous 4 years based on the year selected by the user. For example, if the user selects Y 2017, I'd like it to display totals for Y 2017, Y 2016, Y 2015, and Y 2014 separately. (And if the user selected Y 2013, then it would display the totals for Y 2013, Y2012, Y 2011, and Y2010 separately).
I have some experience with set analysis (which I've used in other contexts but am by no means proficient with yet) and am imagining the solution somehow involves it. In my chart expression, I used the set calculation below and it gives me the total for only 1 year (e.g., it returns the total for Y 2013 when Y 2017 is selected). But that is not exactly what I need -- I need totals for each of the 4 years prior to the selected year to be displayed.
=sum({$<Quarter=,Year={'$(=Max(Year)-4)'}>}Responses)
Any ideas would be appreciated.
Thanks in advance,
-John
Accepted Solutions
- Mark as New
- Bookmark
- Subscribe
- Mute
- Subscribe to RSS Feed
- Permalink
- Report Inappropriate Content
- Mark as New
- Bookmark
- Subscribe
- Mute
- Subscribe to RSS Feed
- Permalink
- Report Inappropriate Content
PSA.
- Mark as New
- Bookmark
- Subscribe
- Mute
- Subscribe to RSS Feed
- Permalink
- Report Inappropriate Content
Thanks so much, Krishna. It worked beautifully. Also, do you have any idea how I might calculate totals by year, so that, within the same chart, I could get % of total? In other words, % of total for each of the 4 years displayed?