Unlock a world of possibilities! Login now and discover the exclusive benefits awaiting you.
- Qlik Community
- :
- All Forums
- :
- QlikView App Dev
- :
- Re: Limiting graph display with a slider
- Subscribe to RSS Feed
- Mark Topic as New
- Mark Topic as Read
- Float this Topic for Current User
- Bookmark
- Subscribe
- Mute
- Printer Friendly Page
- Mark as New
- Bookmark
- Subscribe
- Mute
- Subscribe to RSS Feed
- Permalink
- Report Inappropriate Content
Limiting graph display with a slider
Hi
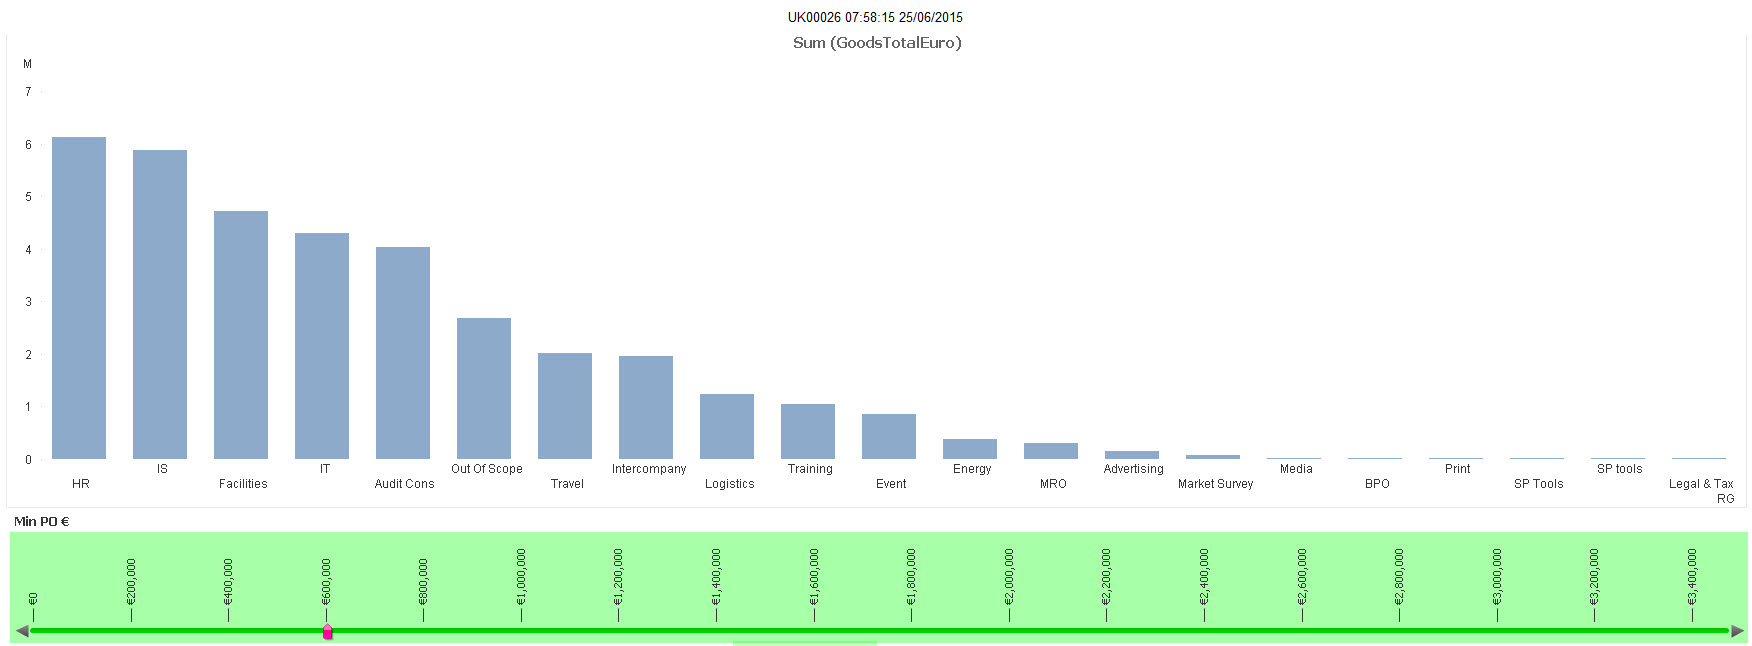
I have a bar graph showing the total value of orders (GoodsTotalEuro) in various groups
I want to limit the value of orders displayed by a slider.
I have the slider controlling a variable (Min_PO) which is set to a value, dependent on where the slider is set.
I have tried to include the Min_PO variable in the expression to limit the display
sum ({$<GoodsTotalEuro > {PO_Min}>}GoodsTotalEuro)
this gives a formula error
and
If(GoodsTotalEuro > {PO_Min, sum(GoodsTotalEuro), 0 )
this displays nothing
Can anyone help please?
- Tags:
- new_to_qlikview
- Mark as New
- Bookmark
- Subscribe
- Mute
- Subscribe to RSS Feed
- Permalink
- Report Inappropriate Content
Barry,
You can try this:
Thanks,
AS
- Mark as New
- Bookmark
- Subscribe
- Mute
- Subscribe to RSS Feed
- Permalink
- Report Inappropriate Content
Hi
May be I was not clear.
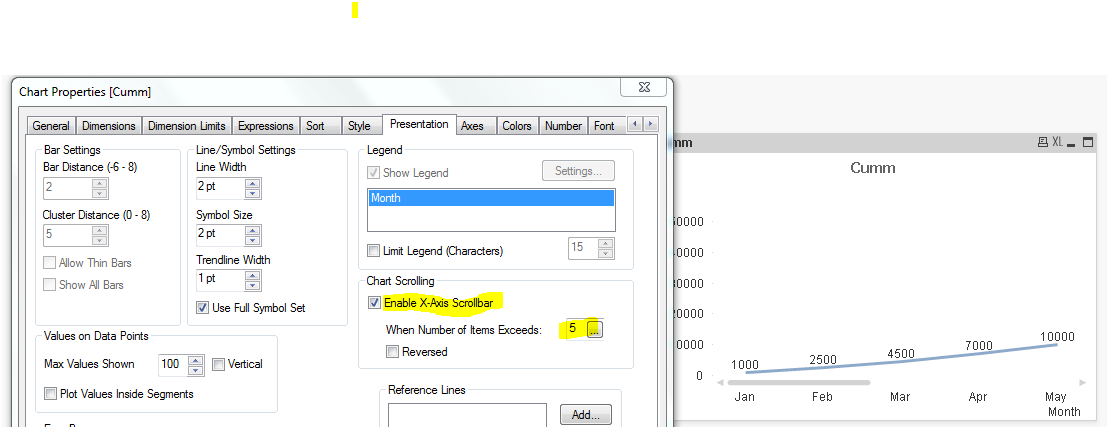
I don't want to limit the horizontal display, or make it part of a scroll
I only want to display the values in the graph which are above X (PO_Min, variable) controlled by the slider.
So if the slider is set to €10,000, then it will only display PO above this value
thanks
Barry