Unlock a world of possibilities! Login now and discover the exclusive benefits awaiting you.
Announcements
April 13–15 - Dare to Unleash a New Professional You at Qlik Connect 2026: Register Now!
- Qlik Community
- :
- All Forums
- :
- QlikView App Dev
- :
- Re: Line Chart Formula Question
Options
- Subscribe to RSS Feed
- Mark Topic as New
- Mark Topic as Read
- Float this Topic for Current User
- Bookmark
- Subscribe
- Mute
- Printer Friendly Page
Turn on suggestions
Auto-suggest helps you quickly narrow down your search results by suggesting possible matches as you type.
Showing results for
Specialist
2013-11-07
04:53 PM
- Mark as New
- Bookmark
- Subscribe
- Mute
- Subscribe to RSS Feed
- Permalink
- Report Inappropriate Content
Line Chart Formula Question
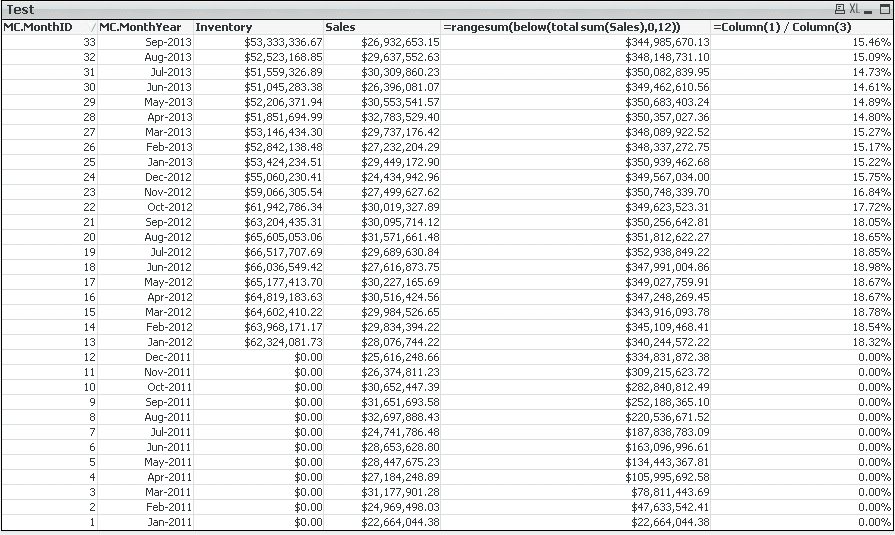
Please help with this tricky situation that I have. I have a request from finance to put the following information into a line chart. They want me to compare the 2013 vs 2012 by month for the last column in the attached screenshot. Basically I'm dividing our Inventory $ by the sum of the last 12 months of Sales. The formulas that I am using work great in a straight table, but not at all in the line chart. Can anyone offer any assistance?
Thank you!
396 Views
1 Reply
Not applicable
2013-11-07
04:58 PM
- Mark as New
- Bookmark
- Subscribe
- Mute
- Subscribe to RSS Feed
- Permalink
- Report Inappropriate Content
I can provide some data for testing
325 Views