Unlock a world of possibilities! Login now and discover the exclusive benefits awaiting you.
Announcements
See why Qlik is a Leader in the 2024 Gartner® Magic Quadrant™ for Analytics & BI Platforms.
Download Now
- Qlik Community
- :
- All Forums
- :
- QlikView App Dev
- :
- Line Chart: Make "no value" as 0
Options
- Subscribe to RSS Feed
- Mark Topic as New
- Mark Topic as Read
- Float this Topic for Current User
- Bookmark
- Subscribe
- Mute
- Printer Friendly Page
Turn on suggestions
Auto-suggest helps you quickly narrow down your search results by suggesting possible matches as you type.
Showing results for
Not applicable
2014-10-30
05:37 AM
- Mark as New
- Bookmark
- Subscribe
- Mute
- Subscribe to RSS Feed
- Permalink
- Report Inappropriate Content
Line Chart: Make "no value" as 0
Hi guys,
I have a line chart that illustrates my revenue for 5 different regions, plus the total revenue.
Instead of showing "0", if there is no data (and thus no revenue) for that region, the graph does not display the graph at all.
I´d like it to show a 0-value, but I cannot figure out the right if-clause.
Can you help me?
Thanks,
Lina
462 Views
4 Replies
Partner - Champion III
2014-10-30
05:40 AM
- Mark as New
- Bookmark
- Subscribe
- Mute
- Subscribe to RSS Feed
- Permalink
- Report Inappropriate Content
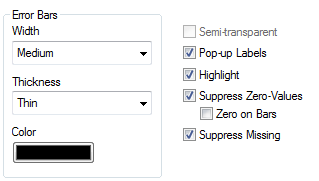
Uncheck suppress zero values in presentatio tab
389 Views
Not applicable
2014-10-30
05:44 AM
Author
- Mark as New
- Bookmark
- Subscribe
- Mute
- Subscribe to RSS Feed
- Permalink
- Report Inappropriate Content
Uncheck the Supress Value Check box in Presentation tab.

Thanks,
Singh
MVP
2014-10-30
06:28 AM
- Mark as New
- Bookmark
- Subscribe
- Mute
- Subscribe to RSS Feed
- Permalink
- Report Inappropriate Content
Try with uncheck the "Suppress When Value Is Null" option in the chart and in the presentation uncheck the Suppress Zero-Values.
Regards
Anand
389 Views
Not applicable
2014-10-30
06:33 AM
Author
- Mark as New
- Bookmark
- Subscribe
- Mute
- Subscribe to RSS Feed
- Permalink
- Report Inappropriate Content
Under dimension tab check show all values
389 Views