Unlock a world of possibilities! Login now and discover the exclusive benefits awaiting you.
- Qlik Community
- :
- All Forums
- :
- QlikView App Dev
- :
- Line Chart QlikView
Options
- Subscribe to RSS Feed
- Mark Topic as New
- Mark Topic as Read
- Float this Topic for Current User
- Bookmark
- Subscribe
- Mute
- Printer Friendly Page
Turn on suggestions
Auto-suggest helps you quickly narrow down your search results by suggesting possible matches as you type.
Showing results for
Contributor III
2017-09-21
03:56 AM
- Mark as New
- Bookmark
- Subscribe
- Mute
- Subscribe to RSS Feed
- Permalink
- Report Inappropriate Content
Line Chart QlikView
hello ,
the following calculation form:
TU = sum(Aggr(count(if(match([Type de commande], 'URGENT','GROS', 'PVI'), [N° ligne])),[N° donneur d'ordre]))/Aggr(sum(Aggr(count([N° ligne]),[N° de commande])),[N° donneur d'ordre])
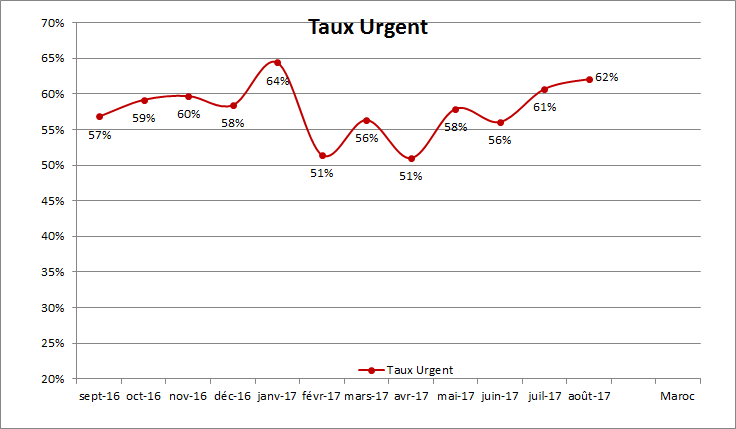
I want to draw a Line Chart of TU in relation to [N° donneur d'ordre]) Last 6 months of this year
Like this :
642 Views
0 Replies