Unlock a world of possibilities! Login now and discover the exclusive benefits awaiting you.
- Qlik Community
- :
- All Forums
- :
- QlikView App Dev
- :
- Re: Line Chart: an issue with displaying multiple ...
Options
- Subscribe to RSS Feed
- Mark Topic as New
- Mark Topic as Read
- Float this Topic for Current User
- Bookmark
- Subscribe
- Mute
- Printer Friendly Page
Turn on suggestions
Auto-suggest helps you quickly narrow down your search results by suggesting possible matches as you type.
Showing results for
Not applicable
2016-07-04
06:25 AM
- Mark as New
- Bookmark
- Subscribe
- Mute
- Subscribe to RSS Feed
- Permalink
- Report Inappropriate Content
Line Chart: an issue with displaying multiple categories on a single chart
State of affairs:
I have certain metric split by multiple products. Number of products can vary, that is the number of lines on the chart can change.
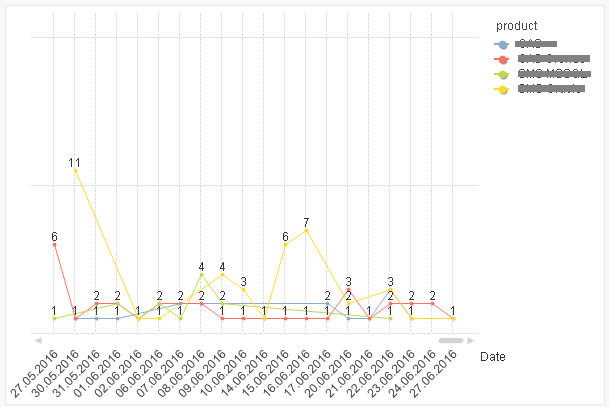
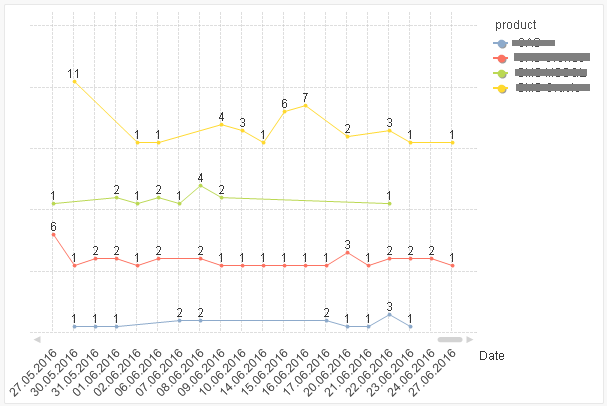
By default a Line Chart gives me two options: to show all products on a single coordinate space (like on picture #1) or to make two X-axes ("Split axis" option). Neither of the two quite fits my needs: the first option makes chart diffucult to read, the second -- obviuosly doesn't solve the problem.
Is there a way to dynamically display on a Line Chart:
- arbitrary number of lines (data groups),
- each on a separate coordinate space (similar to what "Split axis" produces, but for 2+ data groups),
- using a single Line Chart object
?
Picture #1 - What I have currently
Picture #2 - What I'm seeking to do
414 Views
1 Reply
Anonymous
Not applicable
2016-07-04
07:05 AM
Author
- Mark as New
- Bookmark
- Subscribe
- Mute
- Subscribe to RSS Feed
- Permalink
- Report Inappropriate Content
hi,
can u upload .qvw (with sample data)?
351 Views