Unlock a world of possibilities! Login now and discover the exclusive benefits awaiting you.
- Qlik Community
- :
- All Forums
- :
- QlikView App Dev
- :
- Line Chart help
- Subscribe to RSS Feed
- Mark Topic as New
- Mark Topic as Read
- Float this Topic for Current User
- Bookmark
- Subscribe
- Mute
- Printer Friendly Page
- Mark as New
- Bookmark
- Subscribe
- Mute
- Subscribe to RSS Feed
- Permalink
- Report Inappropriate Content
Line Chart help
Hello,
I have a table something like this:
Year_Month Month Product SellOut SellIn
I created a line chart for the last 12 months by product:
- Dimentions:
- Month
- Product
- Expression
- Sum(SellOut)
- Sort: Month=min({<$(vMAT)>}Year_Month)
and works fine, with X (Month) and a line for each product SellOut
When I introduce the expression Sum(SellIn), the X becomes Product and only two lines (SellOut and SellIn - product values sum) appear!!!
How can I resolve this?
Thanks in advance,
Francisco
Accepted Solutions
- Mark as New
- Bookmark
- Subscribe
- Mute
- Subscribe to RSS Feed
- Permalink
- Report Inappropriate Content
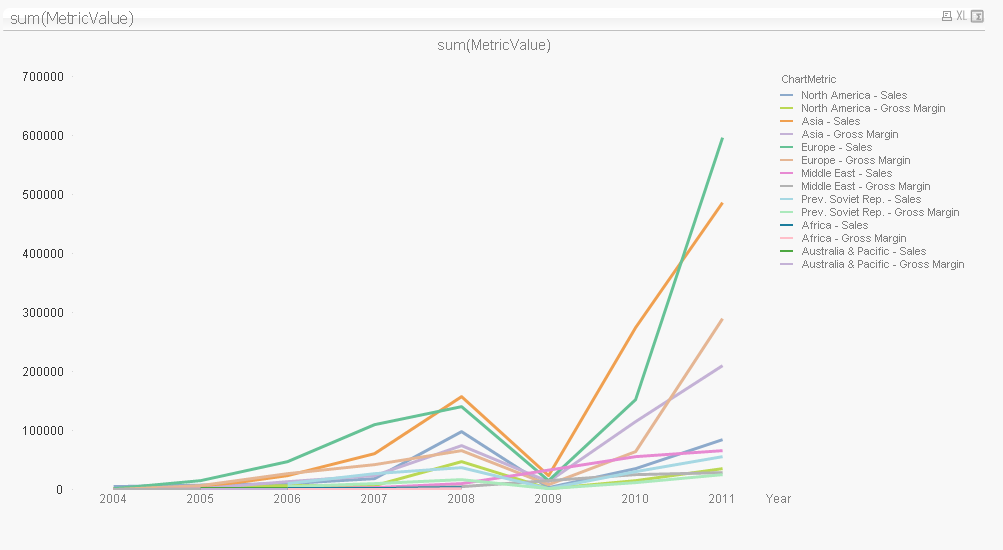
You can do that but you need to combine the dimensions and expressions so that you still only have 2 dims and 1 expression.
1. Load a table that has 2 fields: Metric and Metric value:
Metric will have either 2 values: 'Sellin' or 'Sellout'
MetricValue will have the numeric value from either column depending if its sellin or sellout
2. In the chart your 2nd dimension will be: Product & ' - ' & Metric , and the expression will be sum(MetricValue)
Here is a screenshot example below.
- Mark as New
- Bookmark
- Subscribe
- Mute
- Subscribe to RSS Feed
- Permalink
- Report Inappropriate Content
I think it is the normal behaviour of line chart with 2 dimension and 2 expression
- Mark as New
- Bookmark
- Subscribe
- Mute
- Subscribe to RSS Feed
- Permalink
- Report Inappropriate Content
OK, thanks...
So is there a way I can have a line chart (X - Month Y - Value), with 2 expressions lines for each product?
Note: some products have SellOut but no SellIn
Regards,
FLC
- Mark as New
- Bookmark
- Subscribe
- Mute
- Subscribe to RSS Feed
- Permalink
- Report Inappropriate Content
You can do that but you need to combine the dimensions and expressions so that you still only have 2 dims and 1 expression.
1. Load a table that has 2 fields: Metric and Metric value:
Metric will have either 2 values: 'Sellin' or 'Sellout'
MetricValue will have the numeric value from either column depending if its sellin or sellout
2. In the chart your 2nd dimension will be: Product & ' - ' & Metric , and the expression will be sum(MetricValue)
Here is a screenshot example below.