Unlock a world of possibilities! Login now and discover the exclusive benefits awaiting you.
- Qlik Community
- :
- All Forums
- :
- QlikView App Dev
- :
- Re: Line Chart with Two dimensions and Two dimensi...
- Subscribe to RSS Feed
- Mark Topic as New
- Mark Topic as Read
- Float this Topic for Current User
- Bookmark
- Subscribe
- Mute
- Printer Friendly Page
- Mark as New
- Bookmark
- Subscribe
- Mute
- Subscribe to RSS Feed
- Permalink
- Report Inappropriate Content
Line Chart with Two dimensions and Two expressions
Hi,
Some information so it would be easier to understand:
Let’s say I Have 3 customers: A, B, and C
And each one has two activities he can do each day: sleep and walk (measured in hours)
I want to show a line chart with two dimensions: Date and Customer
And two expressions: The number of hours each customer slept (solid) and the number of customer each customer walked (in dashed).
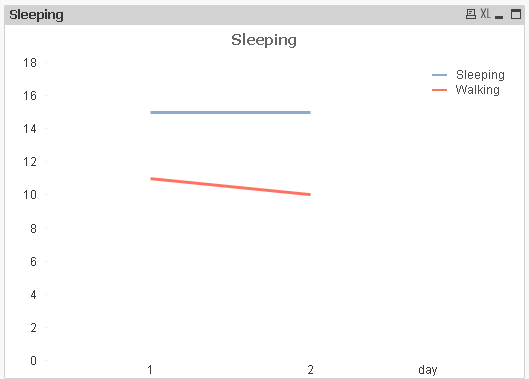
When I do this, instead of plotting two lines per customer (sleep and walk) for a total of 6 lines on the screen,
I get only two lines, the total amount of sleep and walk for each day, without different lines for customers.
How can I change it?
Thanks!
- Tags:
- chart
- line-chart
- Mark as New
- Bookmark
- Subscribe
- Mute
- Subscribe to RSS Feed
- Permalink
- Report Inappropriate Content
Create a Line Chart
Dimension
Date
Customer
Expression
SUM({<activity = {'sleep'}>}hours)
SUM({<activity = {'walk'}>}hours)
- Mark as New
- Bookmark
- Subscribe
- Mute
- Subscribe to RSS Feed
- Permalink
- Report Inappropriate Content
Manish Kachhia, Thanks for replying, but that does not work.
You can try it for yourself with the definitions you wrote and this Inline:
LOAD * INLINE [
Date, Customer, activity, hours
1, 1, sleep, 10
1, 1, walk, 5
1, 2, sleep, 5
1, 2, walk, 6
2, 1, sleep, 9
2, 1, walk, 7
2, 2, sleep, 6
2, 2, walk, 3
];
As soon as the second expression is added, it shows two lines for both customers combined.
- Mark as New
- Bookmark
- Subscribe
- Mute
- Subscribe to RSS Feed
- Permalink
- Report Inappropriate Content
Can you let me know what exactly you want as a end result? I am unclear now from your question..
- Mark as New
- Bookmark
- Subscribe
- Mute
- Subscribe to RSS Feed
- Permalink
- Report Inappropriate Content
Two lines for each customer: one solid that describes how many hours he walked each day, and one dashed describing how many hours he slept that day.
Eventually, there should be 4 lines in this particular example.
Did I explain myself better this time, or is it still unclear?
Thanks!
- Mark as New
- Bookmark
- Subscribe
- Mute
- Subscribe to RSS Feed
- Permalink
- Report Inappropriate Content
Hi,
According to my knowledge you cant use more than two dimensions in line chart.
but try to use aggr() and heck.
BR,
Dinu1
- Mark as New
- Bookmark
- Subscribe
- Mute
- Subscribe to RSS Feed
- Permalink
- Report Inappropriate Content
Hi,
I'm not really familiar with the 'aggr()' function, could you elaborate?
- Mark as New
- Bookmark
- Subscribe
- Mute
- Subscribe to RSS Feed
- Permalink
- Report Inappropriate Content
- Mark as New
- Bookmark
- Subscribe
- Mute
- Subscribe to RSS Feed
- Permalink
- Report Inappropriate Content
- Mark as New
- Bookmark
- Subscribe
- Mute
- Subscribe to RSS Feed
- Permalink
- Report Inappropriate Content
Tharindu Dinuwan,
Thanks for your quick response, I read about 'aggr' but I still don't get how using it will help me.