Unlock a world of possibilities! Login now and discover the exclusive benefits awaiting you.
Announcements
April 13–15 - Dare to Unleash a New Professional You at Qlik Connect 2026: Register Now!
- Qlik Community
- :
- All Forums
- :
- QlikView App Dev
- :
- Line Chart with multiple lines (example attached)
Options
- Subscribe to RSS Feed
- Mark Topic as New
- Mark Topic as Read
- Float this Topic for Current User
- Bookmark
- Subscribe
- Mute
- Printer Friendly Page
Turn on suggestions
Auto-suggest helps you quickly narrow down your search results by suggesting possible matches as you type.
Showing results for
Not applicable
2014-08-05
04:25 PM
- Mark as New
- Bookmark
- Subscribe
- Mute
- Subscribe to RSS Feed
- Permalink
- Report Inappropriate Content
Line Chart with multiple lines (example attached)
Hi,
I need to create something like this:
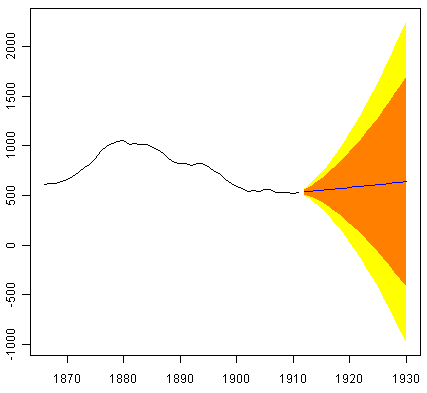
Only the orange bit would be enough.
I see two options:
- Adding another identical expression with a dynamic line width - that would restrict me a lot though and I couldn't put in actual numbers the line should stretch to
- Adding two new expressions (+- a dynamic number of initial expression) and filling in the area in between - but how would I do that?
Can someone help here please?
Thank you! 🙂
733 Views
1 Reply
Not applicable
2014-08-05
04:37 PM
Author
- Mark as New
- Bookmark
- Subscribe
- Mute
- Subscribe to RSS Feed
- Permalink
- Report Inappropriate Content
Another idea: Stacked line chart, first expression is 0.9*expression, second expression is 0.2*expression, colour the first one transparent and the second one in a colour - this gives me the +-10% band of the expression. Any better solutions?
343 Views