Unlock a world of possibilities! Login now and discover the exclusive benefits awaiting you.
- Qlik Community
- :
- All Forums
- :
- QlikView App Dev
- :
- Line Chart
- Subscribe to RSS Feed
- Mark Topic as New
- Mark Topic as Read
- Float this Topic for Current User
- Bookmark
- Subscribe
- Mute
- Printer Friendly Page
- Mark as New
- Bookmark
- Subscribe
- Mute
- Subscribe to RSS Feed
- Permalink
- Report Inappropriate Content
Line Chart
Hi All,
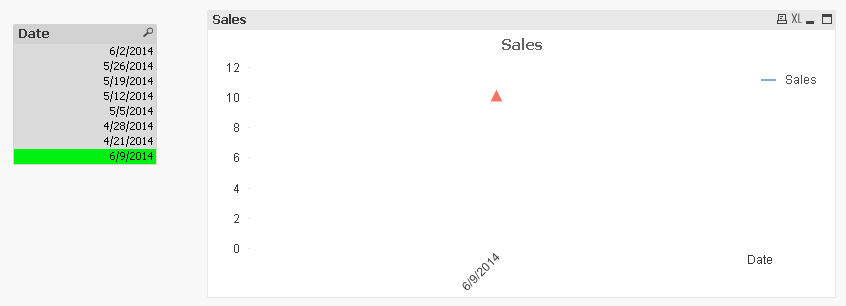
I am using line chart in my dashboard. It showing values as per dates.
Now my requirement is if user select a specific date from date filter then chart will show selected date as well last 3 dates.
at present its showing only the seleted date.
Please help me regarding this.
Accepted Solutions
- Mark as New
- Bookmark
- Subscribe
- Mute
- Subscribe to RSS Feed
- Permalink
- Report Inappropriate Content
- Mark as New
- Bookmark
- Subscribe
- Mute
- Subscribe to RSS Feed
- Permalink
- Report Inappropriate Content
Hi soha,
try set analysis:
- The parameter 1 disregards all user selections to begin with
-> Then you can ´"calculate" (all dates bigger than (selected_date)-3 and smaller_equal (selected_date)
That would be sth like this
>> Sum({1<Date = {$(= '>' & (Getfieldselections(Date)-3))}>} Sales) <<
HTH
Best regards,
DataNibbler
- Mark as New
- Bookmark
- Subscribe
- Mute
- Subscribe to RSS Feed
- Permalink
- Report Inappropriate Content
I tried but it showing error in calculation message.
- Mark as New
- Bookmark
- Subscribe
- Mute
- Subscribe to RSS Feed
- Permalink
- Report Inappropriate Content
Use set analysis and take logic from this link
- Mark as New
- Bookmark
- Subscribe
- Mute
- Subscribe to RSS Feed
- Permalink
- Report Inappropriate Content
One thing that i will suggest is that sort the date dimension in your script.
Assign them values as Rank 1,2,3....etc.
Now you need use calculated expression for the chart.
Now the logic which will work is like take dimension where Rank< current selected date rank and rank>=current selected rank-3.
Here current selected rank can be taken as variable
vRank=if(len(getfieldselected(Date))>0,Rank)
- Mark as New
- Bookmark
- Subscribe
- Mute
- Subscribe to RSS Feed
- Permalink
- Report Inappropriate Content
Hi Sujeet thanks you very much for your help.
Can you please share or update attached qvw file for better understanding.
- Mark as New
- Bookmark
- Subscribe
- Mute
- Subscribe to RSS Feed
- Permalink
- Report Inappropriate Content
Hi
PFA ,try this useful for u or not
- Mark as New
- Bookmark
- Subscribe
- Mute
- Subscribe to RSS Feed
- Permalink
- Report Inappropriate Content
Hi Soha ,
What else need,this application is working
- Mark as New
- Bookmark
- Subscribe
- Mute
- Subscribe to RSS Feed
- Permalink
- Report Inappropriate Content
see the attched file
- Mark as New
- Bookmark
- Subscribe
- Mute
- Subscribe to RSS Feed
- Permalink
- Report Inappropriate Content
Sorry Perumal..I didn't saw your solution.
Thank you very much.