Unlock a world of possibilities! Login now and discover the exclusive benefits awaiting you.
- Qlik Community
- :
- All Forums
- :
- QlikView App Dev
- :
- Line Graph
- Subscribe to RSS Feed
- Mark Topic as New
- Mark Topic as Read
- Float this Topic for Current User
- Bookmark
- Subscribe
- Mute
- Printer Friendly Page
- Mark as New
- Bookmark
- Subscribe
- Mute
- Subscribe to RSS Feed
- Permalink
- Report Inappropriate Content
Line Graph
Hi All,
I am trying to create the following line graph:
Where Number of Completed Work Orders are compared to the Avg days to complete those work orders with the points your see above.
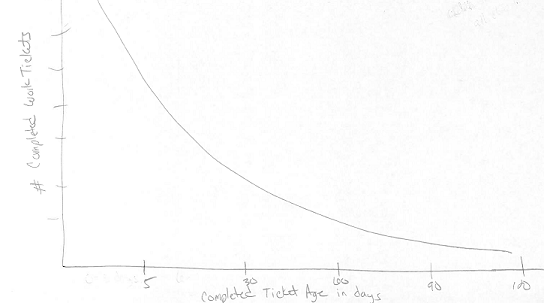
Avg Days # of Work Orders
5 100
30 76
60 40
90 20
100 10
I know I have seen this done in a post but cant locate it right now. Any help would be awesome.
Thanks,
David
- « Previous Replies
-
- 1
- 2
- Next Replies »
- Mark as New
- Bookmark
- Subscribe
- Mute
- Subscribe to RSS Feed
- Permalink
- Report Inappropriate Content
Is Avg days coming from your data? or is that a calculated dimension?
- Mark as New
- Bookmark
- Subscribe
- Mute
- Subscribe to RSS Feed
- Permalink
- Report Inappropriate Content
It is a calculated field in my load statement:
NetWorkDays(RequestDate,ActualCompletionDate)) as DaysAged,
I am also using:
Interval(ActualCompletionDate-[RequestDate],'D') as DaysToComplete,
David
- Mark as New
- Bookmark
- Subscribe
- Mute
- Subscribe to RSS Feed
- Permalink
- Report Inappropriate Content
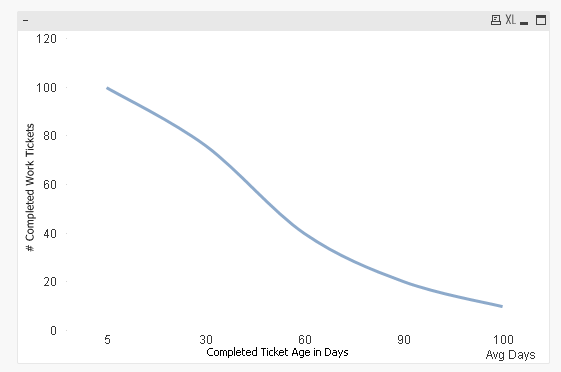
If everything is precalculated in the script, then may be as attached
- Mark as New
- Bookmark
- Subscribe
- Mute
- Subscribe to RSS Feed
- Permalink
- Report Inappropriate Content
Did you use # Completed Work Tickets as the dimension and Completed Ticket as Expression?
- Mark as New
- Bookmark
- Subscribe
- Mute
- Subscribe to RSS Feed
- Permalink
- Report Inappropriate Content
Sorry I did not see your attachment. The number of work orders is not stored in the Load statement.
David
- Mark as New
- Bookmark
- Subscribe
- Mute
- Subscribe to RSS Feed
- Permalink
- Report Inappropriate Content
Would you be able to share some raw data? Aggregated data makes it difficult to get a sample across.
- Mark as New
- Bookmark
- Subscribe
- Mute
- Subscribe to RSS Feed
- Permalink
- Report Inappropriate Content
I have attached my file. Let me know if this makes sense.
- Mark as New
- Bookmark
- Subscribe
- Mute
- Subscribe to RSS Feed
- Permalink
- Report Inappropriate Content
How would you go about calculating # of Work Days based on DaysAged dimension?
- Mark as New
- Bookmark
- Subscribe
- Mute
- Subscribe to RSS Feed
- Permalink
- Report Inappropriate Content
This is how I do it in a straight table. I am trying to figure out how to do it in a graph.
- « Previous Replies
-
- 1
- 2
- Next Replies »