Unlock a world of possibilities! Login now and discover the exclusive benefits awaiting you.
- Qlik Community
- :
- All Forums
- :
- QlikView App Dev
- :
- Line chart break
- Subscribe to RSS Feed
- Mark Topic as New
- Mark Topic as Read
- Float this Topic for Current User
- Bookmark
- Subscribe
- Mute
- Printer Friendly Page
- Mark as New
- Bookmark
- Subscribe
- Mute
- Subscribe to RSS Feed
- Permalink
- Report Inappropriate Content
Line chart break
Hi All,
I have the data on monthly level.
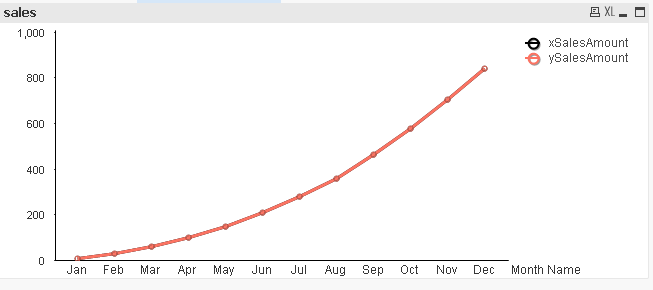
xSales are not availabale from September.But ySales are there for entire year.
I have created a line chart with two lines with xSalesAmount and ySalesAmount.
As data is not there for xSalesAmount from September, want to show ySalesAmount to continue the line.
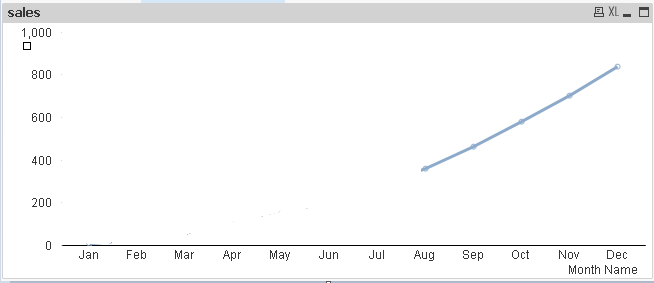
My requirement is ySalesAmount should start from August.
August ySalesAmount =August xSalesAmount
Please help me.
Accepted Solutions
- Mark as New
- Bookmark
- Subscribe
- Mute
- Subscribe to RSS Feed
- Permalink
- Report Inappropriate Content
Hi,
Is it ok to change the color of the line for X and Y values? It is a good option and you will get the line continuously and the expression will be simple.
Please find attached file for solution.
Regards,
Jagan.
- Mark as New
- Bookmark
- Subscribe
- Mute
- Subscribe to RSS Feed
- Permalink
- Report Inappropriate Content
Are you looking to get this?
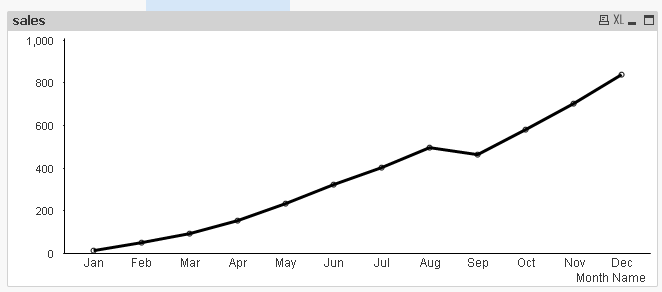
Expression:
=If(Len(Trim(if(GetSelectedCount(Year)=0,
IF(Sum({<Date = {"$(='>=' & Date(YearStart(Max(Date)), 'DD-MMM-YY') & '<=' & Date(Max(Date), 'DD-MMM-YY'))"},[Month Name]=, Month=, Year>}xSales),
Rangesum(Sum({< Date = {"$(='>=' & Date(YearStart(Max(Date)), 'DD-MMM-YY') & '<=' & Date(Max(Date), 'DD-MMM-YY'))"},[Month Name]=, Month=, Year>}ySales),Above("xSalesAmount"))),
IF(Sum({< Date =,[Month Name]=, Month=>}xSales),
Rangesum(Sum({< Date = ,[Month Name]=, Month=>}xSales),Above("xSalesAmount")))
))) = 0,
RangeSum(Above(if(GetSelectedCount(Year)=0,Sum({<Year={'$(=max(Year))'},Date={'<=$(=vMaxXSalesAmount)'},[Month Name], Month>}xSales) + Sum({<Year={'$(=max(Year))'},Date={'>$(=vMaxXSalesAmount)'},[Month Name], Month>}ySales)
,Sum({<Date={'<=$(=vMaxXSalesAmount)'},[Month Name], Month>}xSales) + Sum({< Date={'>$(=vMaxXSalesAmount)'},[Month Name], Month>}ySales)
), 0, RowNo())),
if(GetSelectedCount(Year)=0,
IF(Sum({<Date = {"$(='>=' & Date(YearStart(Max(Date)), 'DD-MMM-YY') & '<=' & Date(Max(Date), 'DD-MMM-YY'))"},[Month Name]=, Month=, Year>}xSales),
Rangesum(Sum({< Date = {"$(='>=' & Date(YearStart(Max(Date)), 'DD-MMM-YY') & '<=' & Date(Max(Date), 'DD-MMM-YY'))"},[Month Name]=, Month=, Year>}ySales),Above("xSalesAmount"))),
IF(Sum({< Date =,[Month Name]=, Month=>}xSales),
Rangesum(Sum({< Date = ,[Month Name]=, Month=>}xSales),Above("xSalesAmount")))
))
- Mark as New
- Bookmark
- Subscribe
- Mute
- Subscribe to RSS Feed
- Permalink
- Report Inappropriate Content
Hi Sunny,
Thanks for the reply.
I want the ySalesAmount like this:
- Mark as New
- Bookmark
- Subscribe
- Mute
- Subscribe to RSS Feed
- Permalink
- Report Inappropriate Content
Hi,
Is it ok to change the color of the line for X and Y values? It is a good option and you will get the line continuously and the expression will be simple.
Please find attached file for solution.
Regards,
Jagan.
- Mark as New
- Bookmark
- Subscribe
- Mute
- Subscribe to RSS Feed
- Permalink
- Report Inappropriate Content
Hi,
I did the following
Expression: =Sum({<Date={'<=$(=vMaxXSalesAmount)'}>}xSales) + Sum({<Date={'>$(=vMaxXSalesAmount)'}>}ySales)
Background Expression: If(Date <= vMaxXSalesAmount, RGB(0,255,0), RGB(0, 0, 255))
Regards,
Jagan.