Unlock a world of possibilities! Login now and discover the exclusive benefits awaiting you.
- Qlik Community
- :
- All Forums
- :
- QlikView App Dev
- :
- Line chart graph interpretation
- Subscribe to RSS Feed
- Mark Topic as New
- Mark Topic as Read
- Float this Topic for Current User
- Bookmark
- Subscribe
- Mute
- Printer Friendly Page
- Mark as New
- Bookmark
- Subscribe
- Mute
- Subscribe to RSS Feed
- Permalink
- Report Inappropriate Content
Line chart graph interpretation
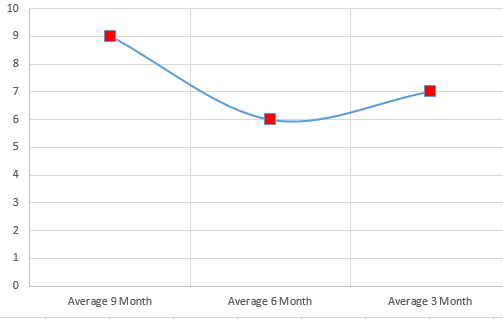
Hi! How can I interpret graph in this way ?
But not in this way, like it happen now (3 measures added to line chart)
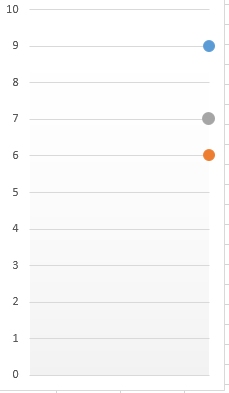
Average 9, Average 6, Average 3 are measures.
Accepted Solutions
- Mark as New
- Bookmark
- Subscribe
- Mute
- Subscribe to RSS Feed
- Permalink
- Report Inappropriate Content
Use value list
e.g. dimension
=ValueList('9 Month','6 Month','3 Month')
expression
if (ValueList('9 Month','6 Month','3 Month') = '9 Month',
Avg( {<OrderDate={"<=$(=Max(OrderDate)) >=$(=AddMonths(Max(OrderDate),-9))"}>} LineSalesAmount),
If( ValueList('9 Month','6 Month','3 Month') = '6 Month',
Avg( {<OrderDate={"<=$(=Max(OrderDate)) >=$(=AddMonths(Max(OrderDate),-6))"}>} LineSalesAmount),
Avg( {<OrderDate={"<=$(=Max(OrderDate)) >=$(=AddMonths(Max(OrderDate),-3))"}>} LineSalesAmount)))
check link for some theory
- Mark as New
- Bookmark
- Subscribe
- Mute
- Subscribe to RSS Feed
- Permalink
- Report Inappropriate Content
Thank your for help!
- Mark as New
- Bookmark
- Subscribe
- Mute
- Subscribe to RSS Feed
- Permalink
- Report Inappropriate Content
No problems