Unlock a world of possibilities! Login now and discover the exclusive benefits awaiting you.
- Qlik Community
- :
- All Forums
- :
- QlikView App Dev
- :
- Re: Line chart help please
- Subscribe to RSS Feed
- Mark Topic as New
- Mark Topic as Read
- Float this Topic for Current User
- Bookmark
- Subscribe
- Mute
- Printer Friendly Page
- Mark as New
- Bookmark
- Subscribe
- Mute
- Subscribe to RSS Feed
- Permalink
- Report Inappropriate Content
Line chart help please
| FileID | Propose | UnderDev |
| 1 | 3/11/2016 | 3/28/2016 |
| 2 | 3/25/2016 | 4/1/2016 |
| 3 | 4/1/2016 | 4/15/2016 |
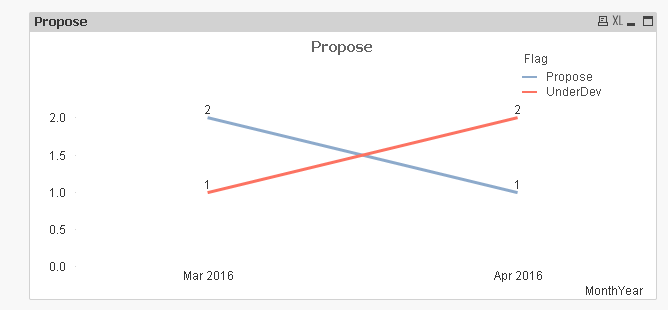
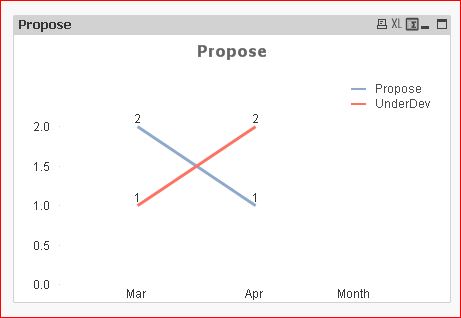
I need to create line chart with 2 line which show count of each dates by Month.
In march Propose count is 2 and In Apr 1
In march Underdev count is 1 and In Apr 2
I may have to combine these 2 dates ? I am not sure.Can you help me ?Thank you.
Accepted Solutions
- Mark as New
- Bookmark
- Subscribe
- Mute
- Subscribe to RSS Feed
- Permalink
- Report Inappropriate Content
Actually what Stefan mentioned works better I guess
Dimensions:
Month
Flag
Expression: Count(Flag)
- Mark as New
- Bookmark
- Subscribe
- Mute
- Subscribe to RSS Feed
- Permalink
- Report Inappropriate Content
You could create a canonical date out of these two date fields:
Then link the canonical date to a master calendar, and use the master cal. month as dimension.
Second dimension could be your date type field and expression =Count(Type)
- Mark as New
- Bookmark
- Subscribe
- Mute
- Subscribe to RSS Feed
- Permalink
- Report Inappropriate Content
sunindia Do yoy have any solution for this please ?
- Mark as New
- Bookmark
- Subscribe
- Mute
- Subscribe to RSS Feed
- Permalink
- Report Inappropriate Content
Thank you and tried this approach but didnt work. I am still a beginner here !
- Mark as New
- Bookmark
- Subscribe
- Mute
- Subscribe to RSS Feed
- Permalink
- Report Inappropriate Content
Hi,
As suggested by swehul, you can try Canonical Date with link of your master calendar.
still, If you want the solution based on your provided data, may be the below script will helps (this is not the good way)
T1:
LOAD * INLINE [
    FileID, Propose, UnderDev
    1, 3/11/2016, 3/28/2016
    2, 3/25/2016, 4/1/2016
    3, 4/1/2016, 4/15/2016
];
T2:
CrossTable(Type,Date)
LOAD * Resident T1;
New:
LOAD *,Month(Date) as Month Resident T2;
DROP Table T1,T2;
- Mark as New
- Bookmark
- Subscribe
- Mute
- Subscribe to RSS Feed
- Permalink
- Report Inappropriate Content
Canonical Calendar method:
Table:
LOAD * Inline [
FileID, Propose, UnderDev
1, 3/11/2016, 3/28/2016
2, 3/25/2016, 4/1/2016
3, 4/1/2016, 4/15/2016
];
LinkTable:
LOAD FileID,
Propose as Date,
'Propose' as Flag
Resident Table;
Concatenate(LinkTable)
LOAD FileID,
UnderDev as Date,
'UnderDev' as Flag
Resident Table;
Temp:
LOAD Max(Date) as MaxDate,
Min(Date) as MinDate
Resident LinkTable;
LET varMaxDate = Peek('MaxDate');
LET varMinDate = Peek('MinDate');
DROP Table Temp;
Calendar:
LOAD Date,
Month(Date) as Month,
Year(Date) as Year,
MonthName(Date) as MonthYear;
LOAD Date($(varMinDate) + IterNo() - 1) as Date
AutoGenerate 1
While $(varMinDate) + IterNo() -1 <= $(varMaxDate);
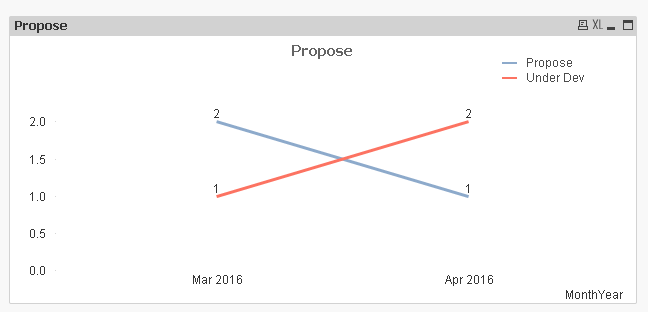
Dimension: Month
Expressions:
1) Count({<Flag = {'Propose'}>}Flag)
2) Count({<Flag = {'UnderDev'}>}Flag)
- Mark as New
- Bookmark
- Subscribe
- Mute
- Subscribe to RSS Feed
- Permalink
- Report Inappropriate Content
Actually what Stefan mentioned works better I guess
Dimensions:
Month
Flag
Expression: Count(Flag)
- Mark as New
- Bookmark
- Subscribe
- Mute
- Subscribe to RSS Feed
- Permalink
- Report Inappropriate Content
Thank you as always  You are my role model