Unlock a world of possibilities! Login now and discover the exclusive benefits awaiting you.
- Qlik Community
- :
- All Forums
- :
- QlikView App Dev
- :
- Re: Line chart showing Current and Previous Year
- Subscribe to RSS Feed
- Mark Topic as New
- Mark Topic as Read
- Float this Topic for Current User
- Bookmark
- Subscribe
- Mute
- Printer Friendly Page
- Mark as New
- Bookmark
- Subscribe
- Mute
- Subscribe to RSS Feed
- Permalink
- Report Inappropriate Content
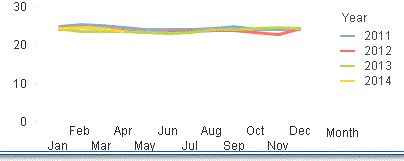
Line chart showing Current and Previous Year
I have this line chart dimension is
1) Month
2) Year
On the expression, I have
1) sum(Sales)
I would like the line chart to show two line chart, current year (2014) and previous year (2013) without user to make any selection.
Is there anything that I can edit on the Year Dimension to show 2013 and 2014 as for this year? Current and previous year

Accepted Solutions
- Mark as New
- Bookmark
- Subscribe
- Mute
- Subscribe to RSS Feed
- Permalink
- Report Inappropriate Content
HI, Benn.
=if( Year>=Year(AddYears(today(),-1)), Year)
and Suppress When Value Is Null Check, If you want.
a year later, can be sustain ![]()
- Mark as New
- Bookmark
- Subscribe
- Mute
- Subscribe to RSS Feed
- Permalink
- Report Inappropriate Content
In Dimension u can write
If(year>2012,Year)
Another Month as Dimension and expression as sum(Sales)
- Mark as New
- Bookmark
- Subscribe
- Mute
- Subscribe to RSS Feed
- Permalink
- Report Inappropriate Content
U can do this in another way if u like mean
Month as Dimension
write 2 expression one for current year and one for previous year
like this
Sum({$<year={"$(=Max(Year))"}>}Sales) for Current Year
Sum({$<year={"$(=Max(Year)-1)"}>}Sales) For previous Year
- Mark as New
- Bookmark
- Subscribe
- Mute
- Subscribe to RSS Feed
- Permalink
- Report Inappropriate Content
this will be 'hard coding' way, tedious to maintain when years to come
- Mark as New
- Bookmark
- Subscribe
- Mute
- Subscribe to RSS Feed
- Permalink
- Report Inappropriate Content
HI, Benn.
=if( Year>=Year(AddYears(today(),-1)), Year)
and Suppress When Value Is Null Check, If you want.
a year later, can be sustain ![]()