Unlock a world of possibilities! Login now and discover the exclusive benefits awaiting you.
- Qlik Community
- :
- All Forums
- :
- QlikView App Dev
- :
- Line chart with line showing average at each point
- Subscribe to RSS Feed
- Mark Topic as New
- Mark Topic as Read
- Float this Topic for Current User
- Bookmark
- Subscribe
- Mute
- Printer Friendly Page
- Mark as New
- Bookmark
- Subscribe
- Mute
- Subscribe to RSS Feed
- Permalink
- Report Inappropriate Content
Line chart with line showing average at each point
Hi everyone,
Sorry I'm new to QlikView and the forums, so I apologise if this is a silly question or in the wrong category or has been answered elsewhere - but if so I would really appreciate being redirected ![]()
So I'm wondering if it's possible to create a line chart (with many lines of data), but then add a single line which shows the average/mean of all the other lines at that point on the x-axis.
So to give an example, say we have a fitness/training course, where competitors take turns to run through a course with timed checkpoints along the way. The course has a "guide" time for each checkpoint, ie the competitors are expected to reach the first checkpoint 60 seconds after they started the course, expected to reach the second checkpoint 90 seconds after they started, etc.
So then say we have data with three fields:
- Competitor (competitor name)
- Checkpoint (checkpoint number)
- TimeDiff (difference between the competitor's actual time at a checkpoint and the "guide" time to reach the checkpoint)
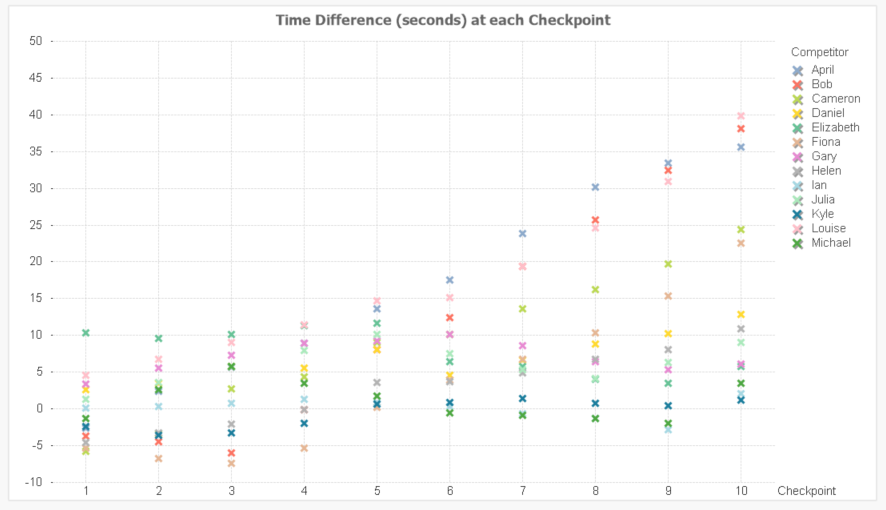
I can easily create a line chart which has Checkpoint along the bottom (x-axis) and TimeDiff along the side (y-axis), with each Competitor as an individual line/series on the graph (by using Checkpoint and Competitor as dimensions and TimeDiff as the expression), like so:
(I've presented the lines without the connecting lines and just with cross symbols)

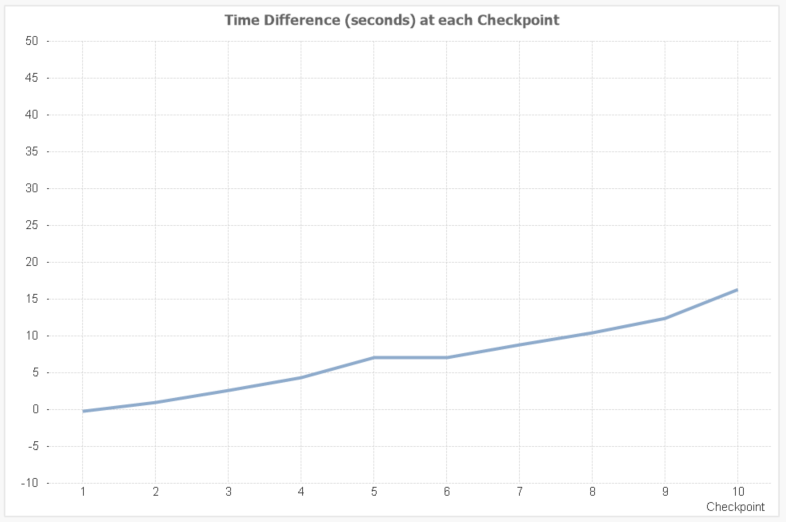
However, I then want to add another line which shows the average/mean of all the competitor's time to reach that individual checkpoint. I can create this as its own chart (by using Checkpoint as dimensions and Avg(TimeDiff) as the expression), like so:

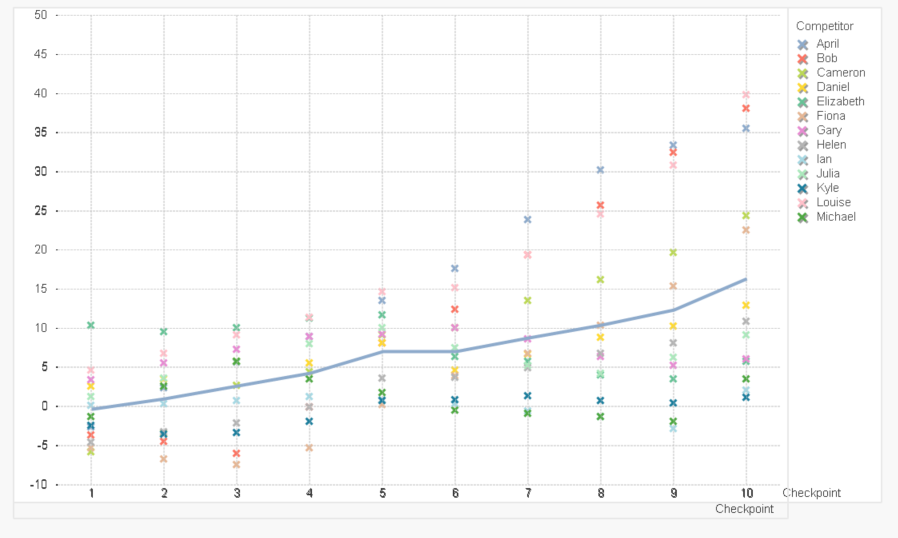
However, I would like them on the same chart. So basically I would like one chart to look like the two charts overlaid, like so:

I would like a solution that works within the chart (ie calculates the average on the fly) and for any numbers of data series, as the idea would be to use a much larger data set (with many more competitors and other fields to filter on, such as age, gender, etc).
Sorry if this is a basic question, I believe QlikView should be able to do this but I've tried fiddling with the dimensions and expressions and can't get it all together on the one chart.
I've attached my QlikView file (with both example data and charts) and the example data on its own (csv file).
Thanks heaps,
Declan
Accepted Solutions
- Mark as New
- Bookmark
- Subscribe
- Mute
- Subscribe to RSS Feed
- Permalink
- Report Inappropriate Content
Yes in this way it's not possible in one single chart because there are two dimensions and two expressions. By a rather small and static amount of checkpoints and/or competitors it might be an alternatively to drop one dimension and using many expressions for it, like:
only({< Competitor = {'Bob'}>} TimeDiff)
only({< Competitor = {'April'}>} TimeDiff)
...
but I think in your case to overlay two charts will be easier.
- Marcus
- Mark as New
- Bookmark
- Subscribe
- Mute
- Subscribe to RSS Feed
- Permalink
- Report Inappropriate Content
It's quite common to overlay two or several charts above eachother to create views which aren't available within one single chart. You need only to adjust the visibility of axis, borders and so on by hiding them or setting them to a transparent color with argb(0,0,0,0).
- Marcus
- Mark as New
- Bookmark
- Subscribe
- Mute
- Subscribe to RSS Feed
- Permalink
- Report Inappropriate Content
Hi Marcus, thanks for the reply!
So it's just not possible to create this as one chart?
If not then I will go for the overlay method.
- Mark as New
- Bookmark
- Subscribe
- Mute
- Subscribe to RSS Feed
- Permalink
- Report Inappropriate Content
Yes in this way it's not possible in one single chart because there are two dimensions and two expressions. By a rather small and static amount of checkpoints and/or competitors it might be an alternatively to drop one dimension and using many expressions for it, like:
only({< Competitor = {'Bob'}>} TimeDiff)
only({< Competitor = {'April'}>} TimeDiff)
...
but I think in your case to overlay two charts will be easier.
- Marcus