Unlock a world of possibilities! Login now and discover the exclusive benefits awaiting you.
- Qlik Community
- :
- All Forums
- :
- QlikView App Dev
- :
- Re: Line chart with two dimensions, AGGR and accum...
- Subscribe to RSS Feed
- Mark Topic as New
- Mark Topic as Read
- Float this Topic for Current User
- Bookmark
- Subscribe
- Mute
- Printer Friendly Page
- Mark as New
- Bookmark
- Subscribe
- Mute
- Subscribe to RSS Feed
- Permalink
- Report Inappropriate Content
Line chart with two dimensions, AGGR and accumulation
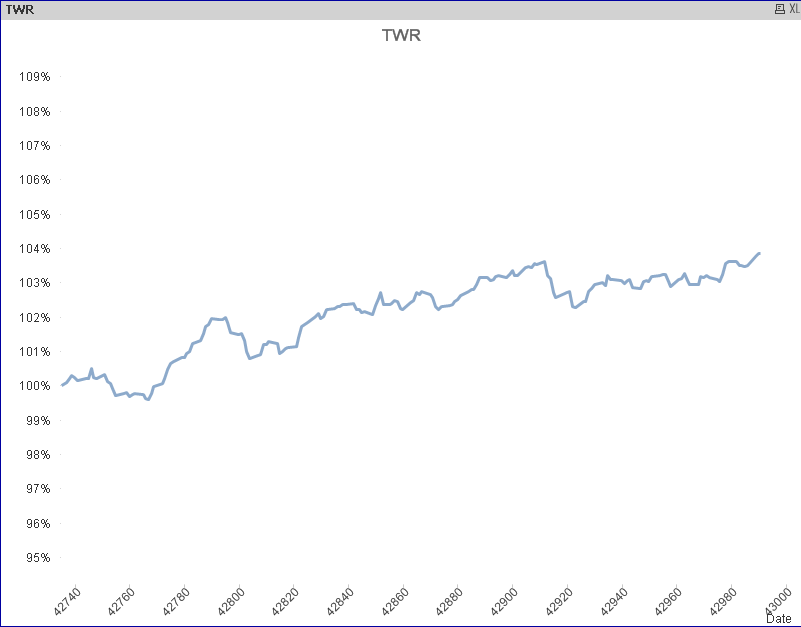
I'm trying to make a line graph showing the performance of multiple investment portfolios. I'm able to create this for all portfolios grouped together, with PRODDATE as the only dimension using "No accumulation" and the following formula:
exp(RANGESUM(above(
log(1+AGGR($(vPerf),PRODDATE))
,0,RowNo())))
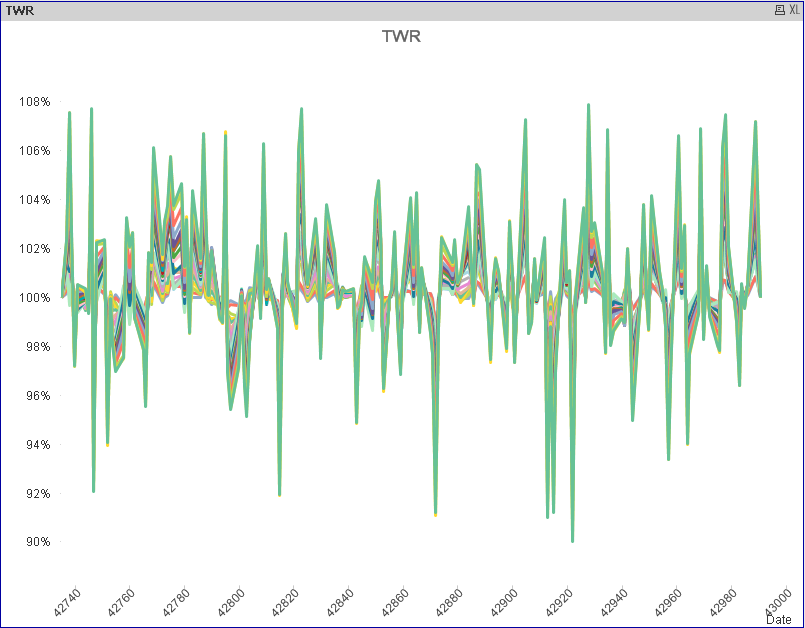
Trying to add the dimension SUB_PRODUCT_NAME to both the aggr expression and as a dimension produces this graph, which is not right at all
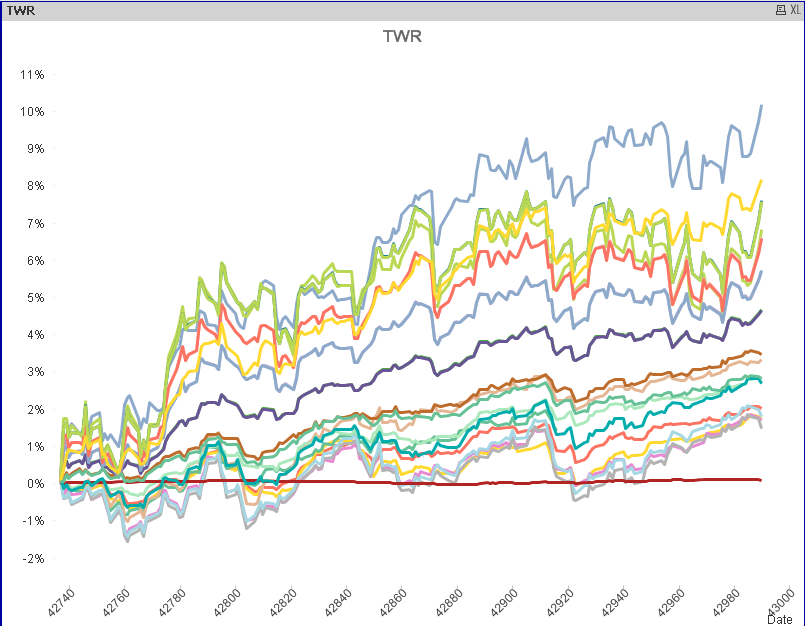
If I run the following expression, and set "Full accumulation" and change the expression to
log(1+AGGR($(vPerf),SUB_PRODUCT_NAME,PRODDATE))
I get the correct log values, but this is not what my audience is expecting, they need to see the exponential numbers (what I'm doing is calculating the product over time).
I have tried and failed so many times now, that I'm about to give up. Anyone who has an idea on how to produce a graph of the exponential values as they evolve over time (PRODDATE)?
Accepted Solutions
- Mark as New
- Bookmark
- Subscribe
- Mute
- Subscribe to RSS Feed
- Permalink
- Report Inappropriate Content
How about this?
Aggr(exp(RangeSum(Above(log(1+Aggr($(vPerf),SUB_PRODUCT_NAME, PRODDATE)), 0, RowNo()))), SUB_PRODUCT_NAME, PRODDATE)
- Mark as New
- Bookmark
- Subscribe
- Mute
- Subscribe to RSS Feed
- Permalink
- Report Inappropriate Content
Try this
Aggr(exp(RangeSum(Above(log(1+Aggr($(vPerf),PRODDATE)), 0, RowNo()))), SUB_PRODUCT_NAME, PRODDATE)
- Mark as New
- Bookmark
- Subscribe
- Mute
- Subscribe to RSS Feed
- Permalink
- Report Inappropriate Content
Thanks for the suggestion Sunny.
Unfortunatley it did not yield the correct result. I ended up with the following graph: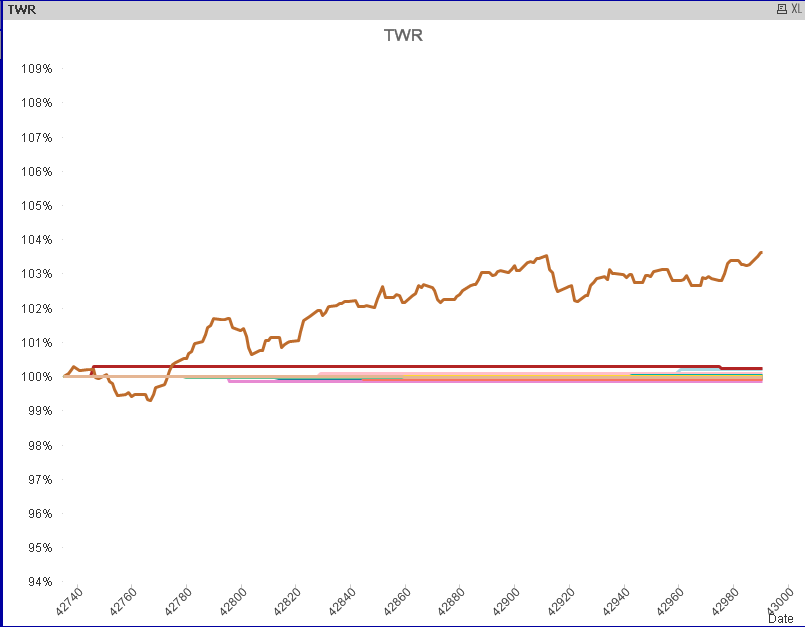
- Mark as New
- Bookmark
- Subscribe
- Mute
- Subscribe to RSS Feed
- Permalink
- Report Inappropriate Content
How about this?
Aggr(exp(RangeSum(Above(log(1+Aggr($(vPerf),SUB_PRODUCT_NAME, PRODDATE)), 0, RowNo()))), SUB_PRODUCT_NAME, PRODDATE)
- Mark as New
- Bookmark
- Subscribe
- Mute
- Subscribe to RSS Feed
- Permalink
- Report Inappropriate Content
Just caught that myself. Thank you very much Sunny. You just made my day!