Unlock a world of possibilities! Login now and discover the exclusive benefits awaiting you.
- Qlik Community
- :
- All Forums
- :
- QlikView App Dev
- :
- Re: Line chart with x axis in%
- Subscribe to RSS Feed
- Mark Topic as New
- Mark Topic as Read
- Float this Topic for Current User
- Bookmark
- Subscribe
- Mute
- Printer Friendly Page
- Mark as New
- Bookmark
- Subscribe
- Mute
- Subscribe to RSS Feed
- Permalink
- Report Inappropriate Content
Line chart with x axis in%
Hi:
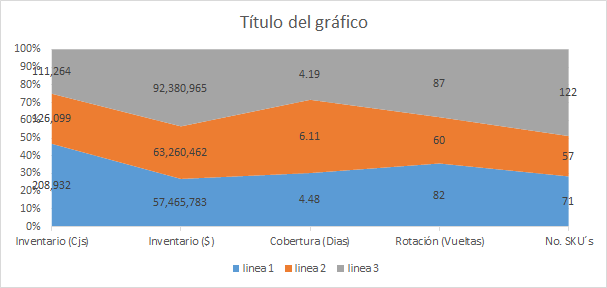
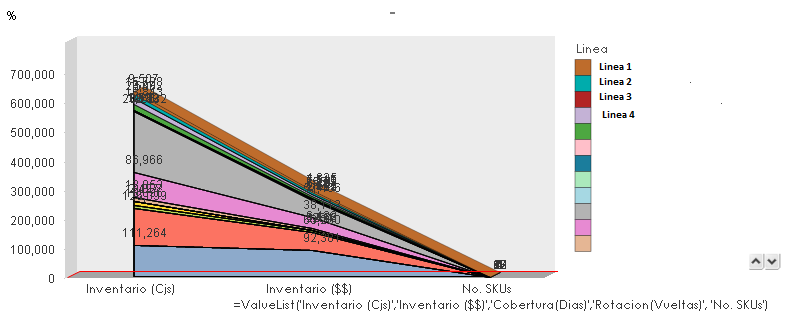
I will trying to do this chart into qlikview, but I did not find how to put x-axe in %, this char is done in Excel.
I am used a pick in expresión
=pick(
Match(
ValueList('Inventario (Cjs)','Inventario ($$)','Cobertura(Dias)','Rotacion(Vueltas)', 'No. SKUs'), 'Inventario (Cjs)','Inventario ($$)','Cobertura(Dias)','Rotacion(Vueltas)', 'No. SKUs')
,sum( CantidadGlobal)
,sum((CantidadGlobal* CostoGlobal) / 1000)
,((sum(CantidadGlobal* CostoGlobal) / sum({<Mes=, IDFECHA={">$(vfechaini) <=$(vfechafin)"} >} PronosticoDiario * Costo) / 3) * 30)
, 365 / ((sum(CantidadGlobal* CostoGlobal ) / sum({<Mes=, IDFECHA={">$(vfechaini) <=$(vfechafin)"} >} PronosticoDiario * Costo)) * 30)
,count (distinct CodProducto)
)
and is correct that how shows the values, but I need shows x-axe in porcent similar to Excel chart, the next char is how shows qlikview

Title was edited by Community Moderator for English translation.
- Mark as New
- Bookmark
- Subscribe
- Mute
- Subscribe to RSS Feed
- Permalink
- Report Inappropriate Content
May be try this:
=Pick(Match(ValueList('Inventario (Cjs)','Inventario ($$)','Cobertura(Dias)','Rotacion(Vueltas)', 'No. SKUs'), 'Inventario (Cjs)','Inventario ($$)','Cobertura(Dias)','Rotacion(Vueltas)', 'No. SKUs'),
Dual(Sum(CantidadGlobal), Sum(CantidadGlobal)/Sum(TOTAL CantidadGlobal)),
Dual(Sum((CantidadGlobal* CostoGlobal) / 1000), Sum((CantidadGlobal* CostoGlobal) / 1000)/Sum(TOTAL (CantidadGlobal* CostoGlobal) / 1000)),
((Sum(CantidadGlobal* CostoGlobal) / sum({<Mes=, IDFECHA={">$(vfechaini) <=$(vfechafin)"} >} PronosticoDiario * Costo) / 3) * 30)
, 365 / ((sum(CantidadGlobal* CostoGlobal ) / sum({<Mes=, IDFECHA={">$(vfechaini) <=$(vfechafin)"} >} PronosticoDiario * Costo)) * 30),
Dual(Count (distinct CodProducto), Count (distinct CodProducto)/Count (TOTAL Distinct CodProducto)))
The portion in red might have to be played around with, but try the rest may be. Or share a sample ![]()
- Mark as New
- Bookmark
- Subscribe
- Mute
- Subscribe to RSS Feed
- Permalink
- Report Inappropriate Content
Thank Sunny for your help, i will send you the examples. The excel file the values to grafica.qvd into sheet "carga", in the sheet "hoja1" is the example from my user, the user change the position to obtain the chart.
Regards
De: Sunny T
Enviado el: jueves, 21 de abril de 2016 01:52 p.m.
Para: Carmen Valencia Flores <carmen.valencia@madrilena.com.mx>
Asunto: Re: - Line chart with x axis in%
Qlik Community <https://community.qlik.com/?et=watches.email.thread>
Line chart with x axis in%
respuesta de Sunny T<https://community.qlik.com/people/sunindia?et=watches.email.thread> en QlikView Creating Analytics - Ver la discusión completa<https://community.qlik.com/message/1024492?et=watches.email.thread#1024492>
- Mark as New
- Bookmark
- Subscribe
- Mute
- Subscribe to RSS Feed
- Permalink
- Report Inappropriate Content
This?
=Pick(
Match(
ValueList('Inventario (Cjs)','Inventario ($$)','Cobertura(Dias)','Rotacion(Vueltas)', 'No. SKUs'), 'Inventario (Cjs)','Inventario ($$)','Cobertura(Dias)','Rotacion(Vueltas)', 'No. SKUs')
,Dual(sum(invcjs), sum(invcjs)/sum(TOTAL invcjs))
,Dual(sum(invmon), sum(invmon)/sum(TOTAL invmon))
,Dual(sum(cobertura), sum(cobertura)/sum(TOTAL cobertura))
,Dual(sum(rotacion), sum(rotacion)/sum(TOTAL rotacion))
,Dual(sum(nosku), sum(nosku)/sum(TOTAL nosku))
)
- Mark as New
- Bookmark
- Subscribe
- Mute
- Subscribe to RSS Feed
- Permalink
- Report Inappropriate Content
Perfect!!, tomorrow I am reviewing the chart with user to get his approval, thanks a lot
- Mark as New
- Bookmark
- Subscribe
- Mute
- Subscribe to RSS Feed
- Permalink
- Report Inappropriate Content
If your question is now answered, please flag the Correct Answer.
If not, please let us know what part of this topic you still need help with ![]() .
.
- Mark as New
- Bookmark
- Subscribe
- Mute
- Subscribe to RSS Feed
- Permalink
- Report Inappropriate Content
hi sunny, why when I apply the DUAL in mi qvd the values are 1,
if I use
Pick(
Match(
ValueList('Inventario (Cjs)','Inventario ($$)'), 'Inventario (Cjs)','Inventario ($$)')
,sum(CantidadGoblal)
,sum(impinvglobal / 1000)
)

but when apply Dual show this
=Pick(
Match(
ValueList('Inventario (Cjs)','Inventario ($$)'), 'Inventario (Cjs)','Inventario ($$)')
, Dual(sum(CantidadGlobal), sum(CantidadGlobal) / sum(TOTAL CantidadGlobal))
,Dual(sum(impinvglobal / 1000), sum(impinvglobal / 1000)/sum(TOTAL impinvglobal / 1000))
)

- Mark as New
- Bookmark
- Subscribe
- Mute
- Subscribe to RSS Feed
- Permalink
- Report Inappropriate Content
May be look at this thread? Bar chart scale with percentage
- Mark as New
- Bookmark
- Subscribe
- Mute
- Subscribe to RSS Feed
- Permalink
- Report Inappropriate Content
sorry, I found the problema is the format I have to select the first option
thanks