Unlock a world of possibilities! Login now and discover the exclusive benefits awaiting you.
- Qlik Community
- :
- All Forums
- :
- QlikView App Dev
- :
- Line graph scales are not detailed when Zoom In
- Subscribe to RSS Feed
- Mark Topic as New
- Mark Topic as Read
- Float this Topic for Current User
- Bookmark
- Subscribe
- Mute
- Printer Friendly Page
- Mark as New
- Bookmark
- Subscribe
- Mute
- Subscribe to RSS Feed
- Permalink
- Report Inappropriate Content
Line graph scales are not detailed when Zoom In
Hi,
I have a general question regarding a "zoom in" for more details in the Y - Axis , and I will explain :
If I have several values like 10,177,177.5,178.2, 208,2000, 2300 - It is clear that the Y-Axis will show values between zero (or greater - irrelevant) to ~3000 and the jump\gap between the greed lines will be big BUT why when I zoom in to a specific time which includes the values 177,177.5 , 178.2 the 3 points are shown between 2 greed line (in the Y-Axes) from 10 existing greed lines.
When zoom in most of the upper and lower space in the line graph in empty, I would expect to see that the greed line will be in smaller gaps, (like from 176 to 180 with 0.5 between the greed lines.
A real other example in the attached files, I would have expected that in the 'After Zoom In" the Y-Axis will be more detailed between
480-495.
I know of property scales static Min\Max but I need flexibility since my values are varied and Zoom In \Zoom out according to user's needs.
Nir Gil
.jpg)
- Mark as New
- Bookmark
- Subscribe
- Mute
- Subscribe to RSS Feed
- Permalink
- Report Inappropriate Content
You can tailor the zoom to your user needs as you like by using expressions/calculations for the static min, max and step options instead of static values
- Mark as New
- Bookmark
- Subscribe
- Mute
- Subscribe to RSS Feed
- Permalink
- Report Inappropriate Content
Hi Nir,
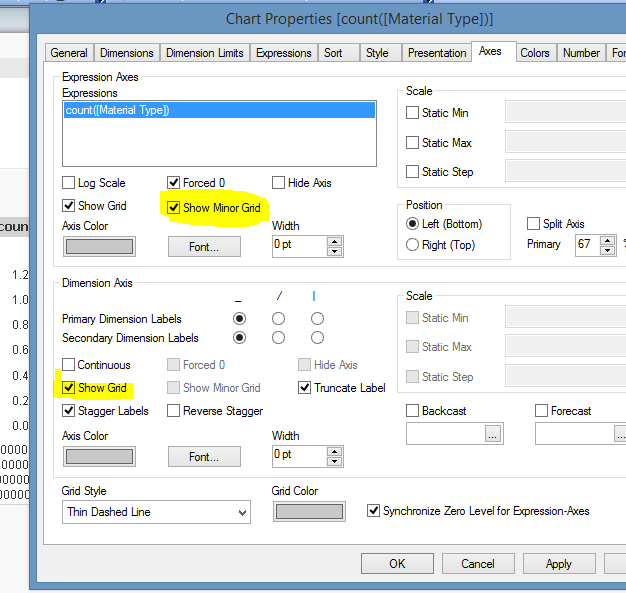
checking below highlighted options may help you . I am unable to open your jpg files .
Regards,
Ganesh.
- Mark as New
- Bookmark
- Subscribe
- Mute
- Subscribe to RSS Feed
- Permalink
- Report Inappropriate Content
Hi,
1. static min, max and step options instead of static values - is not relevant to my problem (as I wrote in the original message).
2.Minor greed is also not relevant.
My problem is that the Y-Axes greed line, which present the values (The X-greed line presents the dates) are not Adjusted properly when all the presented points appear in one 'greed line box' from 8 'greed line boxes'.
How come in a line chart, which show 15 points with varied values between 41,700 to 41,900 the Y-Axis (8 of them) are running from 40,000 to 43,500 and Jump\show greed line every 500,000.
I would expect it to be from 41,500 to 42,000 and Jump\show greed line every 100,000. or even better to show every 50,000 in this case.
And when I show, in the same chart 15 points with varied values between 40,300 to 43,200 than adjust greed line from 40,000 to 43,500.
Nir
- Mark as New
- Bookmark
- Subscribe
- Mute
- Subscribe to RSS Feed
- Permalink
- Report Inappropriate Content
The grid lines are determined by the static step to a minimum of 6
- Mark as New
- Bookmark
- Subscribe
- Mute
- Subscribe to RSS Feed
- Permalink
- Report Inappropriate Content
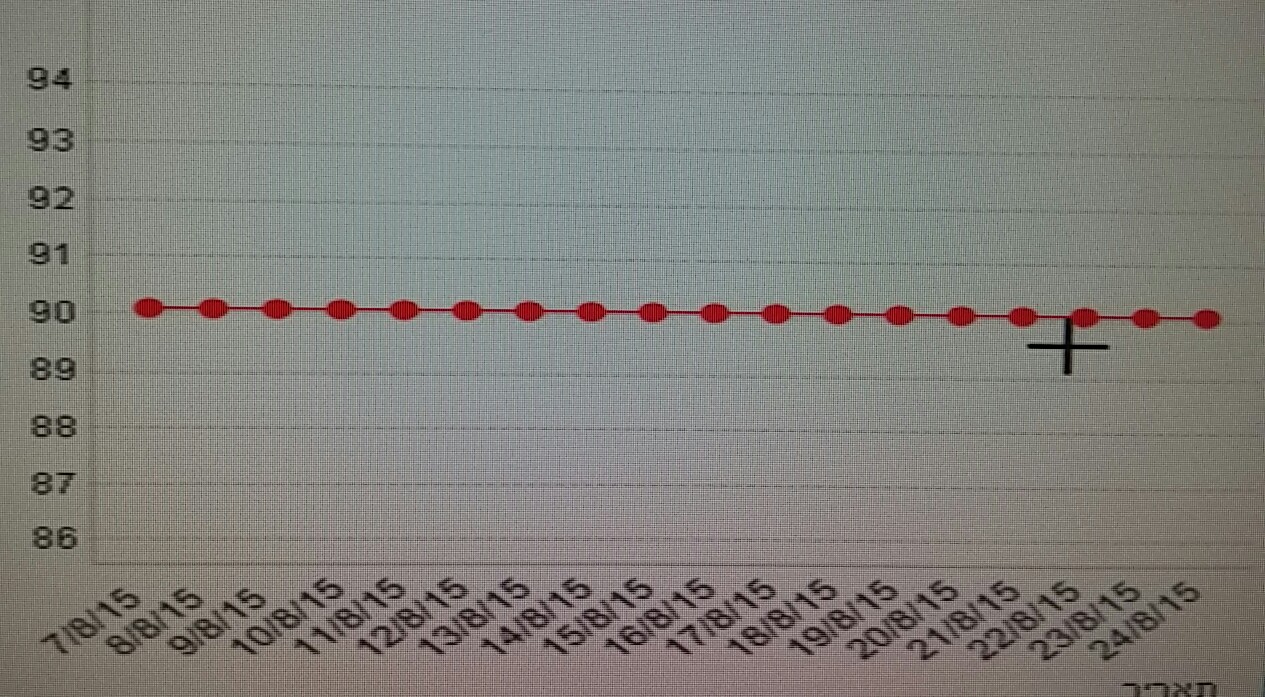
Attached is a photo in which maybe my problem will be clear:
In this photo you can see that all the point are spread near one SINGLE Y-Axis greed line.
I would have expect the greed line to automatically changed, In this zoom-in example, to a range between 89-91 and with jump of 1/3 or 1/2 or something similar so the user can see the little differences between the values.
AGAIN, I would have not expect the range to be smaller if one of the points was out of range.