Unlock a world of possibilities! Login now and discover the exclusive benefits awaiting you.
- Qlik Community
- :
- All Forums
- :
- QlikView App Dev
- :
- Re: Lines & x axis wording not showing on Line Gra...
- Subscribe to RSS Feed
- Mark Topic as New
- Mark Topic as Read
- Float this Topic for Current User
- Bookmark
- Subscribe
- Mute
- Printer Friendly Page
- Mark as New
- Bookmark
- Subscribe
- Mute
- Subscribe to RSS Feed
- Permalink
- Report Inappropriate Content
Lines & x axis wording not showing on Line Graph
Hi All
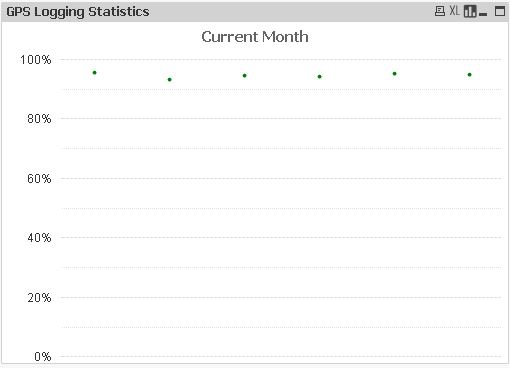
I have a line graph that plots 6 points. Points on the diagram are fine but there is no line joining them up. Also on the x-axis the wording is not displaying as it would do if it were a bar graph.
Can anyone help?
Thanks
James
- Mark as New
- Bookmark
- Subscribe
- Mute
- Subscribe to RSS Feed
- Permalink
- Report Inappropriate Content
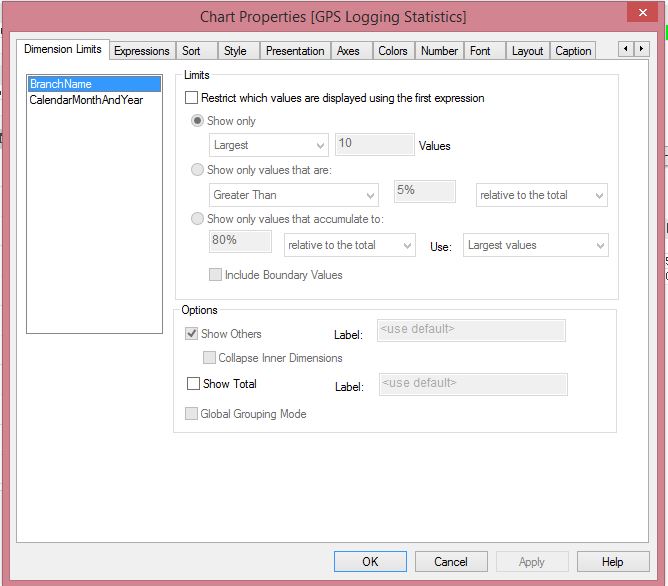
Can you share your Dimensions and expression details, looks like something wrong in selection of dims.
- Mark as New
- Bookmark
- Subscribe
- Mute
- Subscribe to RSS Feed
- Permalink
- Report Inappropriate Content
Could be over lapping some where. Can you go properties and then Use Always TOP from Layout Layer or you may share the snap for better approach
- Mark as New
- Bookmark
- Subscribe
- Mute
- Subscribe to RSS Feed
- Permalink
- Report Inappropriate Content
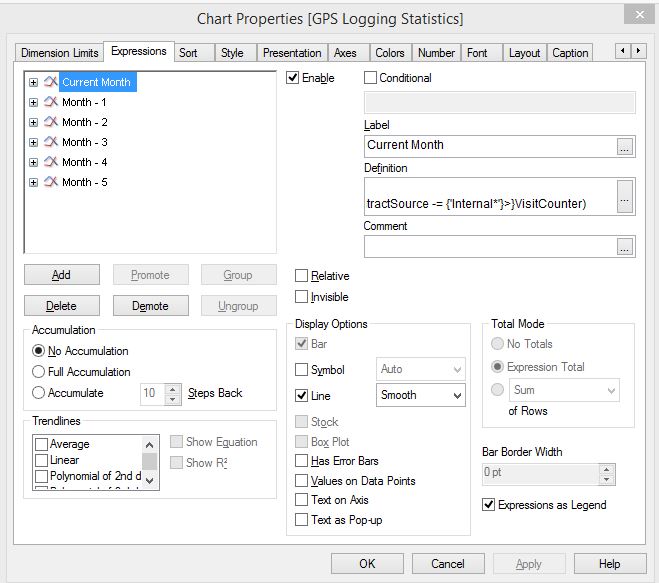
Thanks for having a look, please see below for the graph I currently have and then the dimensions and expressions
- Mark as New
- Bookmark
- Subscribe
- Mute
- Subscribe to RSS Feed
- Permalink
- Report Inappropriate Content
Hi, don't seem to have an Always on Top selection on the Layout window.
- Mark as New
- Bookmark
- Subscribe
- Mute
- Subscribe to RSS Feed
- Permalink
- Report Inappropriate Content
Can you share snip shot of Axis Tab
- Mark as New
- Bookmark
- Subscribe
- Mute
- Subscribe to RSS Feed
- Permalink
- Report Inappropriate Content
the line is created based on the dimension associated, by creating multiple expressions you are basically creating 6 different lines(DOTS as you can see, because there is no associated dimension)
I suggest you use MonthName as dimension and change your expression to sum for last six months example, below
you should be able to see a line by MonthName for the 6 months
sum( {< Date = {">=(Date#(Monthstart(Addmonth(Today(),-5)),'DD/MM/YYYY')
<=(Date#(MonthEnd(Today())),'DD/MM/YYYY')"}
>}Sales)
see this post for dates in set analysis
If a post helps to resolve your issue, please accept it as a Solution.