Unlock a world of possibilities! Login now and discover the exclusive benefits awaiting you.
- Qlik Community
- :
- All Forums
- :
- QlikView App Dev
- :
- Linest M combination of aggr function in qlikview
- Subscribe to RSS Feed
- Mark Topic as New
- Mark Topic as Read
- Float this Topic for Current User
- Bookmark
- Subscribe
- Mute
- Printer Friendly Page
- Mark as New
- Bookmark
- Subscribe
- Mute
- Subscribe to RSS Feed
- Permalink
- Report Inappropriate Content
Linest M combination of aggr function in qlikview
Hi Team,
Could you please explain how the Linest M function work flow in qlik view?
How it will pik the values from x axis and y axis after that how it derived particular value is the result of Linest m value?
for ex:
linest_m(aggr(sum(Sales),Customer,Month),Month)
in above case Linest m function how it will perform?here linest m create a temp table then how can i find that Linest m temp table?
in above function we are using AGGR .as of i know AGGR function create a temp table.how can i see AGGR temp table ?
finally i will get some value like
Let us say Linest m value is 3 ----how can i find this calculation and how can agree 3 is the correct result ?
Think advance .i need pure functionality like top to bottom
Thanks,
Bobb
- Mark as New
- Bookmark
- Subscribe
- Mute
- Subscribe to RSS Feed
- Permalink
- Report Inappropriate Content
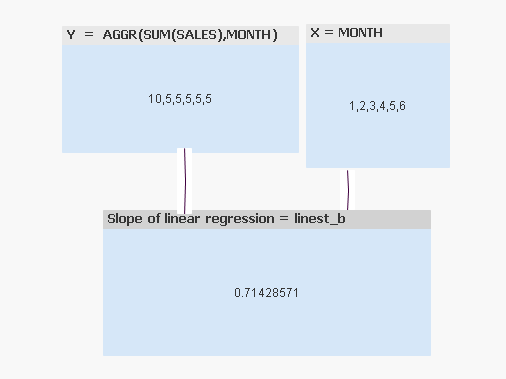
To start with linest_M to get the slope of the linear regression line, I think it is better to be clear what's the X and Y. I made a quick app to explain linest M with X = Month and Y = aggregated sales by month across all customers. Hope it helps.
- Mark as New
- Bookmark
- Subscribe
- Mute
- Subscribe to RSS Feed
- Permalink
- Report Inappropriate Content
Hi youyunjupiter,
great reply
but i have one doubt how then calculation happen in Linest m ?
its great understandable for what is x and what is y but 
Regards,
Bob
- Mark as New
- Bookmark
- Subscribe
- Mute
- Subscribe to RSS Feed
- Permalink
- Report Inappropriate Content
Sorry, I am not sure whether I understand your question.. In the scatter plot, the red line is the regression line and its formula shows the slope is ~=0.71, which is linest_m. It should be the standard calculation for slope in regression.