Unlock a world of possibilities! Login now and discover the exclusive benefits awaiting you.
- Qlik Community
- :
- All Forums
- :
- QlikView App Dev
- :
- Re: Linking two tables & achieve the expected outp...
- Subscribe to RSS Feed
- Mark Topic as New
- Mark Topic as Read
- Float this Topic for Current User
- Bookmark
- Subscribe
- Mute
- Printer Friendly Page
- Mark as New
- Bookmark
- Subscribe
- Mute
- Subscribe to RSS Feed
- Permalink
- Report Inappropriate Content
Linking two tables & achieve the expected output
Dear Experts!
Please refer two excel tables which I need to link & create a table like the 3rd one to show a simple profit/loss calculation. Of course the two months revenue & commissions to be converted to running average & to take the latest month running average (Aug) & to be taken to the 3rd table. The figures in 1st table to be taken as it is.
Thanks in advance
Neville
1st Table
BRANCH GROSS_PREMIUM CLAIMS EXPENSES
RA 2,000,000 450,000 400000
EH 1,500,000 500,000 350000
K7 1,700,000 650,000 250000
K9 1,500,000 700,000 350000
2nd Table
BRANCH MONTH REVENUE COMMISSION
RA JUL 2000000 250000
RA AUG 2200000 350000
EH JUL 1500000 400000
EH AUG 1700000 350000
K7 JUL 900000 200000
K9 JUL 750000 150000
K9 AUG 700000 250000
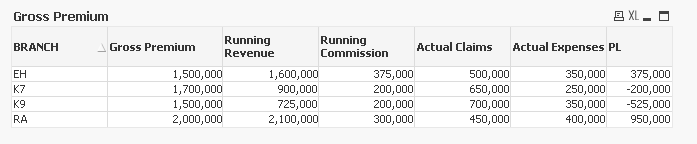
Output should look like below:
BRANCH GROSS_PREMIUM RUNNING_REVENUE RUNNING_COMMISSION ACTUAL CLAIMS ACTUAL EXPENSES PROFIT/LOSS
RA 2,000,000 2100000 300000 450,000 400000 950,000
EH 1,500,000 1600000 375000 500,000 350000 375,000
K7 1,700,000 950000 225000 650,000 250000 (175,000)
K9 1,500,000 725000 200000 700,000 350000 (525,000)
- « Previous Replies
-
- 1
- 2
- Next Replies »
Accepted Solutions
- Mark as New
- Bookmark
- Subscribe
- Mute
- Subscribe to RSS Feed
- Permalink
- Report Inappropriate Content
This is true!, I have just said as it is appeared in your working of course it has to be
| 2,040,743 |
How did you derive the value of 2654689 for BL?
Sorry
- Mark as New
- Bookmark
- Subscribe
- Mute
- Subscribe to RSS Feed
- Permalink
- Report Inappropriate Content
Neville,
Please look at attached, on my way to the airport so no time to add a description of what I'm doing here.
I believe this is what you're looking for.
Good luck!
Oscar
- Mark as New
- Bookmark
- Subscribe
- Mute
- Subscribe to RSS Feed
- Permalink
- Report Inappropriate Content
Dear Oscar,
That is what I need. Will you please show me how you link the tables & expression used thereafter!
Thanks
Neville
- Mark as New
- Bookmark
- Subscribe
- Mute
- Subscribe to RSS Feed
- Permalink
- Report Inappropriate Content
Neville,
I did not change anything as far as the script goes. The two tables are automatically associated by the common BRANCH column.
For the chart I used the BRANCH as my dimension and the following for expressions:
Gross Premium = Sum(GROSS_PREMIUM)
Running Revenue = Avg(REVENUE)
Running Commission = Avg(COMMISSION)
Actual Claims = Avg(CLAIMS)
Actual Expenses = Avg(EXPENSES)
P&L = [Running Revenue] - ([Running Commission] + [Actual Claims] + [Actual Expenses])
Good luck
Oscar
- Mark as New
- Bookmark
- Subscribe
- Mute
- Subscribe to RSS Feed
- Permalink
- Report Inappropriate Content
Dear Oscar,
Thanks a lot for your quick response!
That was OK. Also, if I applied 1st expression given below to find running average , how it will be fitted to this. Also how that expression be brought in to table. If you dont mind please look in to that. The 2nd expression I wrote to bring in latest running value which in August but an error comes!
Thanks in advance
Neville
RangeAvg(ABOVE(RangeSum(REVENUE),0,RowNo()))
sum({<BRANCH={'RA','EH','K7','K9'},MONTH={'AUG'}>}RangeAvg(ABOVE(RangeSum(REVENUE),0,RowNo()))
- Mark as New
- Bookmark
- Subscribe
- Mute
- Subscribe to RSS Feed
- Permalink
- Report Inappropriate Content
Dear Oscar,Wishwanath or any other Dear ones,
Oscar of course helped me to get my job done. But some parts that is running through my mind needs to get corrected!
As I have stated above, Monthly Revenue & other variables are given & to be linked to p&l simple format. As Mr Oscar said (avg) function worked. But If I am to use the running latest month value to be considered at the P&l summery. How it could be done. This will be very much the case when it comes to 3rd Month & so on. (If is is 3rd Month I need to pick the latest 3rd Month Value as the running average. Please look in to this.
Rgds
Neville
- Mark as New
- Bookmark
- Subscribe
- Mute
- Subscribe to RSS Feed
- Permalink
- Report Inappropriate Content
Neville,
I'm sorry but I don't understand exactly what you are looking for. Could you provide an example of your need based on the data you provided what would your expected results look like?
Thanks
Oscar
- Mark as New
- Bookmark
- Subscribe
- Mute
- Subscribe to RSS Feed
- Permalink
- Report Inappropriate Content
Dear oscar,
There are two table as below. 1st one carries Monthly Revenue , commissions & their running averages. 2nd table is for the calculation of profit/loss from part of data taken from 1st table & balance from other tables. You had taken the average using (AVG) function earlier that was when it was only for two Months. But when its is more Months, I need to consider the latest running revenue & commission as per data given below Rs 268750 a revenue & Rs 23125 as commissions!. Please propose an expression to take the latest Month Average figure!
Thanks
Neville
| TABLE_A | ||||
| MONTH | REVENUE | RUNN_AVERAGE_REVENUE | COMMISSION | RUNN_AVERAGE_COMMISSION |
| JUL | 250000 | 250,000 | 15,000 | 15,000 |
| AUG | 200000 | 225,000 | 25,000 | 20,000 |
| SEP | 275000 | 241,667 | 22,500 | 20,833 |
| OCT | 350000 | 268,750 | 30,000 | 23,125 |
| TABLE_B | ||||
| RUNN_REVENUE | RUNN_COMMISSION | PROFIT/LOSS | ||
| 268,750 | 23,125 | 245,625 | ||
- Mark as New
- Bookmark
- Subscribe
- Mute
- Subscribe to RSS Feed
- Permalink
- Report Inappropriate Content
Neville,
I think you may be trying to do something like this:
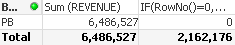
If( RowNo() = 0,
Sum(REVENUE) / Count(REVENUE),
RangeAvg( ABOVE( RangeSum( REVENUE ),0,RowNo() ) )
)
Thanks
Oscar
- Mark as New
- Bookmark
- Subscribe
- Mute
- Subscribe to RSS Feed
- Permalink
- Report Inappropriate Content
Dear Oscar,
Once I applied your expression, correct running average is calculated (as at SEP) but is picked & appeared in the total row only. This has to be shown before each BR_CODES! Can you please what could be the reason & appreciate if the modified expression is forwarded!
I have attached two excel file as well for your ref.
Thanks
Neville
| BR_CODE | MONTH | REVENUE | ACQUISITION_COST | INV_OTHER_INCOME | FIXED_EXPENSES |
| RA | JUL | 6,892,201 | 1,113,069 | 2,100,831 | 3,730,930 |
| RA | AUG | 7,190,963 | 910,909 | 2,514,500 | 4,181,955 |
| RA | SEP | 6,500,000 | 1,100,000 | 2,100,000 | 3,850,000 |
| EH | JUL | 2,675,146 | 384,723 | (168,547) | 1,003,989 |
| EH | AUG | 2,644,461 | 262,054 | (137,098) | 1,075,201 |
| EH | SEP | 2,644,461 | 262,054 | (137,098) | 1,075,201 |
| K7 | JUL | 714,923 | 99,870 | (18,503) | 410,905 |
| K7 | AUG | 738,177 | 68,660 | (25,595) | 437,711 |
| K7 | SEP | 738,177 | 68,660 | (25,595) | 437,711 |
| K9 | JUL | 1,088,208 | 145,972 | (26,411) | 607,038 |
| K9 | AUG | 1,106,821 | 130,553 | 57,376 | 590,378 |
| K9 | SEP | 1,106,821 | 130,553 | 57,376 | 590,378 |
| EM | JUL | 6,185,824 | 908,980 | 143,648 | 2,308,546 |
| EM | AUG | 6,394,567 | 783,171 | 523,857 | 2,538,108 |
| EM | SEP | 6,394,567 | 783,171 | 523,857 | 2,538,108 |
| AS | JUL | 1,362,913 | 171,510 | 94,049 | 546,051 |
| AS | AUG | 1,346,740 | 149,874 | 160,994 | 607,066 |
| AS | SEP | 1,346,740 | 149,874 | 160,994 | 607,066 |
| TA | JUL | 688,378 | 85,529 | (16,300) | 337,675 |
| TA | AUG | 713,250 | 95,188 | 1,247 | 361,033 |
| TA | SEP | 713,250 | 95,188 | 1,247 | 361,033 |
| MY | JUL | 1,386,786 | 196,622 | 32,293 | 637,114 |
| MY | AUG | 1,393,789 | 211,653 | 29,653 | 685,471 |
| MY | SEP | 1,393,789 | 211,653 | 29,653 | 685,471 |
| KW | JUL | 1,978,907 | 337,108 | (22,233) | 769,713 |
| KW | AUG | 2,271,812 | 267,363 | 73,240 | 859,696 |
| KW | SEP | 1,978,907 | 337,108 | (22,233) | 769,713 |
| LW | JUL | 1,211,797 | 212,784 | 122,140 | 737,843 |
| LW | AUG | 1,388,349 | 172,332 | 164,891 | 768,098 |
| LW | SEP | 1,211,797 | 212,784 | 122,140 | 737,843 |
| PA | JUL | 863,655 | 126,358 | (19,628) | 512,060 |
| PA | AUG | 811,104 | 83,412 | (9,752) | 517,445 |
| PA | SEP | 863,655 | 126,358 | (19,628) | 512,060 |
| GD | JUL | 460,808 | 52,130 | (18,006) | 294,921 |
| GD | AUG | 463,772 | 24,213 | (17,082) | 333,540 |
| GD | SEP | 463,772 | 24,213 | (17,082) | 333,540 |
| BL | JUL | 2,015,615 | 322,607 | 55,042 | 1,089,059 |
| BL | AUG | 2,053,307 | 238,509 | 149,433 | 1,122,053 |
| BL | SEP | 2,053,307 | 238,509 | 149,433 | 1,122,053 |
| PB | JUL | 2,127,336 | 358,277 | 24,376 | 847,249 |
| PB | AUG | 2,159,191 | 397,732 | 115,694 | 897,907 |
| PB | SEP | 2,200,000 | 450,000 | 150,000 | 950,000 |
| BR_CODE | CLAIMS |
| RA | 500000 |
| EH | 200000 |
| K7 | 150000 |
| K9 | 200000 |
| EM | 450000 |
| AS | 150000 |
| TA | 50000 |
| MY | 75000 |
| KW | 125000 |
| LW | 250000 |
| PA | 300000 |
| GD | 225000 |
| BL | 150000 |
| PB | 250000 |
- « Previous Replies
-
- 1
- 2
- Next Replies »