Unlock a world of possibilities! Login now and discover the exclusive benefits awaiting you.
- Qlik Community
- :
- All Forums
- :
- QlikView App Dev
- :
- Re: List top n values in a text Object
- Subscribe to RSS Feed
- Mark Topic as New
- Mark Topic as Read
- Float this Topic for Current User
- Bookmark
- Subscribe
- Mute
- Printer Friendly Page
- Mark as New
- Bookmark
- Subscribe
- Mute
- Subscribe to RSS Feed
- Permalink
- Report Inappropriate Content
List top n values in a text Object
Hi Gurus,
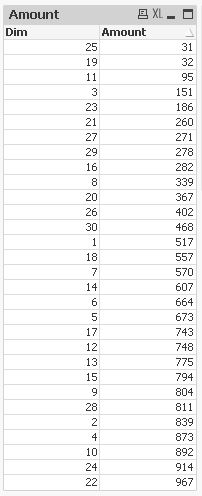
I have created a straight table which displays the Dimension values and sorted them as per the Rank calculated in the expression.
Now, I need to display all the top 10 values that I see in the Straight Table in one Text Object .
Using FirstSortedValue function in the Text Object, I could only display the top 1 or bottom 1 value.
Any ideas please..
-----
I also need to display Top 10, Bottom 10, and wrap all the rest of the Dimension values into 3 more Text Objects.
- Mark as New
- Bookmark
- Subscribe
- Mute
- Subscribe to RSS Feed
- Permalink
- Report Inappropriate Content
Maybe like this (assuming Sum(Value) is the expression used):
=Concat({<DimensionField = {"=Rank(Sum(Value))<=10"}>} DISTINCT DimensionField,', ', -Sum(Value) )
=Concat({<DimensionField = {"=Rank(-Sum(Value))<=10"}>} DISTINCT DimensionField,', ', -Sum(Value) )
=Concat({<DimensionField -= ( {"=Rank(Sum(Value))<=10"} +{"=Rank(-Sum(Value))<=10"} ) >}
DISTINCT DimensionField,', ', -Sum(Value) )
to list top 10, bottom 10 and all inbetween
- Mark as New
- Bookmark
- Subscribe
- Mute
- Subscribe to RSS Feed
- Permalink
- Report Inappropriate Content
Hi Swehl,
Thank you for the quick response.
I think i had it from your expression and realized that I may not have clearly stated my requirement.
I apologize.
Here's the error I am receiving in Text Object: Error in Expression. Nested aggregation not allowed
The Rank Expression that I am trying to use in the text object is a value = sum of 3 other ranks generated using 3 aggregated expression.
i.,e
RankA = Rank(sum(X)) * (.3)
+
RankB = Rank(AVG(Y)) * (.4)
+
RankC = Rank(sum(Z)) * (.3)
---
Please let me know if you rather prefer it to be created as a seperate discussion
- Mark as New
- Bookmark
- Subscribe
- Mute
- Subscribe to RSS Feed
- Permalink
- Report Inappropriate Content
Right, the sort weight needs advanced aggregation, like
=Concat(
{<DimensionField = {"=Rank(Sum(Value))<=10"}>}
DISTINCT
DimensionField,
', ',
Aggr(-Sum(Value),DimensionField)
)
What if you replace Rank(Sum(Value)) in above expression with your sum-of-three-ranks?
How do you get a total rank for your rank expression, BTW, are you using another rank function around the sum-of-three-ranks?
- Mark as New
- Bookmark
- Subscribe
- Mute
- Subscribe to RSS Feed
- Permalink
- Report Inappropriate Content
Hi,
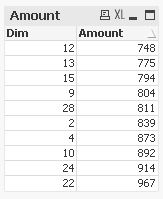
if you already have the correct values in a straight table then maybe you can make it appear as a text box if that's your preferred visualization.
You could use dimension limits, hide caption, header rows and some columns and switch to horizontal presentation:
using dimension limits:
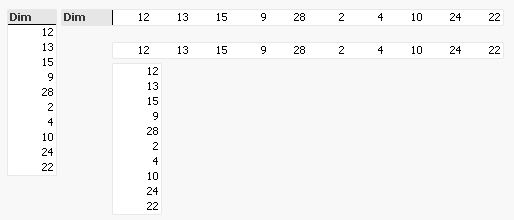
hiding caption and header row and using horizontal presentation.
hidden dimension

hidden expression
hope this helps
regards
Marco
- Mark as New
- Bookmark
- Subscribe
- Mute
- Subscribe to RSS Feed
- Permalink
- Report Inappropriate Content
Hi swehl,
Yes, i have to create a rank of the weighted sum of the three ranks ie., Rank(RankA*x% + RankB*y% + RankC*z%).
I made progress using the Advanced aggregation you suggested.
I was able to make some progress in displaying the top N values in one single 'text object'.
However, my requirement also needed me to display some additional dimension and expression values when I hover over each of the Dimension values in the 'text object'.
This leads me to create one 'text object' for each Rank. Then, i need to somehow use the 'Help Text' under 'Caption tab' of the 'text object' to display the required additional dimension and expression values relevant to the Dimension.
So, i gave up on this approach and started looking at creating one 'Straight Table' for each of the Dimension values that would look like a 'text object' as Marco also suggested.
---
Hi Marco,
I started using this approach. Since I have to display more details when I hover over each of the Dimension values, I ended up creating about 300 straight tables with Conditional show/hide of each value ie., one for each Dimension value as I need to display all the Dimension values by Default. All these 300 straight tables are arranged in the required order of Top N , Everything in Between, Bottom N.
This has affected the Dashboard performance. The dashboard is not loading data unless i pass very little data.
So, even though I have visually what the user is looking to see, it just not effectively reloading data as needed.
--
I appreciate any advice and thank you for the help so far