Unlock a world of possibilities! Login now and discover the exclusive benefits awaiting you.
- Qlik Community
- :
- All Forums
- :
- QlikView App Dev
- :
- Re: Log Scale is not displaying real values
- Subscribe to RSS Feed
- Mark Topic as New
- Mark Topic as Read
- Float this Topic for Current User
- Bookmark
- Subscribe
- Mute
- Printer Friendly Page
- Mark as New
- Bookmark
- Subscribe
- Mute
- Subscribe to RSS Feed
- Permalink
- Report Inappropriate Content
Log Scale is not displaying real values
Hi,
I have a table that with the following structure:
Year-Month
Items created
Items sold
Store
So, in some months we sold the stock and not as many as we created, for example:
Store Year-Month IC IS
1 2017-01 100 25
2 2017-01 20 7
3 2017-01 55 30
1 2017-02 50 30
2 2017-02 12 15
3 2017-02 40 16
1 2017-03 110 90
2 2017-03 28 7
3 2017-03 35 30
I have created a line chart to display the percentage of sales against creation. Like the following:
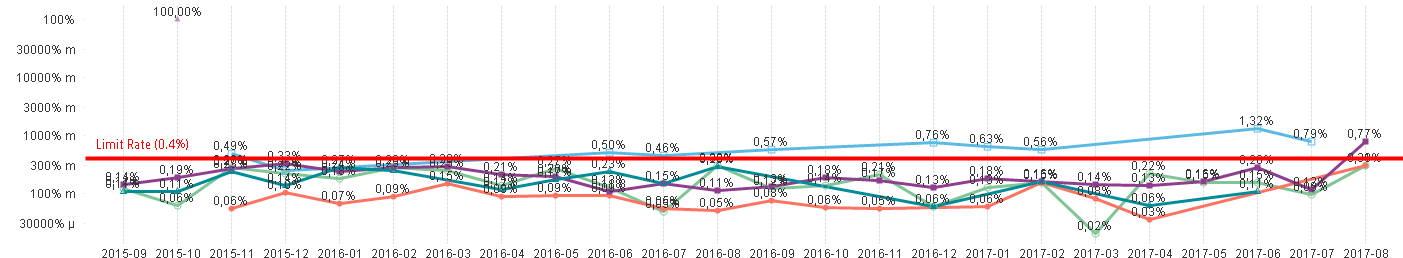
The information is displayed properly (the values are calculated IC/IS to get the percentage). The problem is with the log scale, it's not displaying correct or understandable values. If I removed the log scale I got the following:
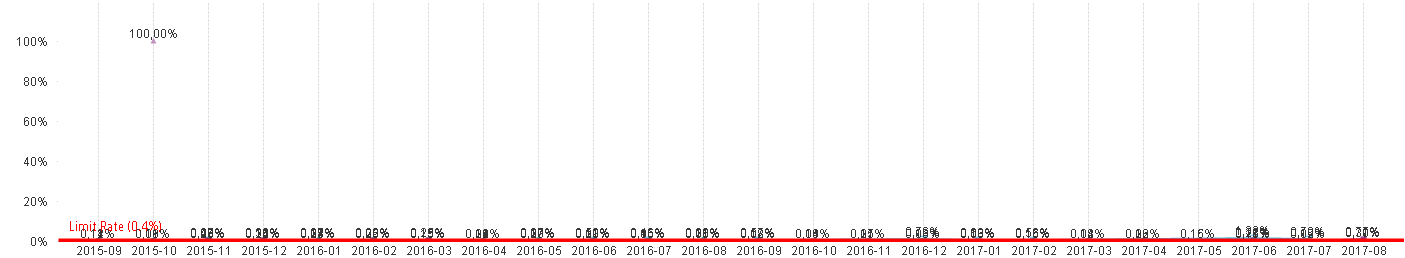
The numbers cannot be read. Is there a way to manipulate the log scale to represent the data from 0 to 10% and then the rest. I will like to see the information as the first chart but with the scale similar to the second.
Is this possible?
Thanks,
- Tags:
- log scale
- « Previous Replies
-
- 1
- 2
- Next Replies »
Accepted Solutions
- Mark as New
- Bookmark
- Subscribe
- Mute
- Subscribe to RSS Feed
- Permalink
- Report Inappropriate Content
Hi, also you can set the limits for the axis in the 'Scale' box. Set 0.1 in 'Static Max' to limit it to 10%
- Mark as New
- Bookmark
- Subscribe
- Mute
- Subscribe to RSS Feed
- Permalink
- Report Inappropriate Content
Hi,
- Mark as New
- Bookmark
- Subscribe
- Mute
- Subscribe to RSS Feed
- Permalink
- Report Inappropriate Content
Hi, also you can set the limits for the axis in the 'Scale' box. Set 0.1 in 'Static Max' to limit it to 10%
- Mark as New
- Bookmark
- Subscribe
- Mute
- Subscribe to RSS Feed
- Permalink
- Report Inappropriate Content
Will it be possible for you to provide sample data set?
- Mark as New
- Bookmark
- Subscribe
- Mute
- Subscribe to RSS Feed
- Permalink
- Report Inappropriate Content
This worked, however the numbers above 100% are not being displayed (as this one case and don't happened anymore I will leave it this way).
Thank you!
- Mark as New
- Bookmark
- Subscribe
- Mute
- Subscribe to RSS Feed
- Permalink
- Report Inappropriate Content
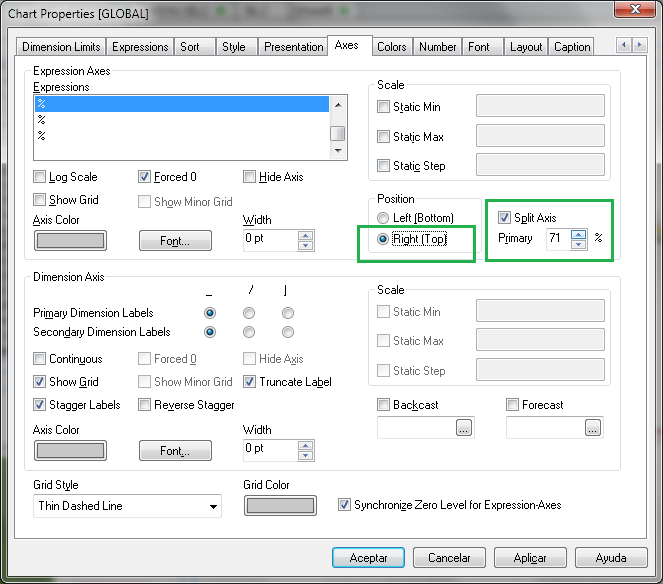
Hi Roberto, have you tried Fer answer to split the axis?
You can try splitting the axis and setting limits for each splitted axis, the bad thing about this is that usually the max limit label of the bottom chart overlaps with the min limit label of the upper chart.
- Mark as New
- Bookmark
- Subscribe
- Mute
- Subscribe to RSS Feed
- Permalink
- Report Inappropriate Content
Yes, I have tried that, but didn't work, that change didn't modify the chart.
- Mark as New
- Bookmark
- Subscribe
- Mute
- Subscribe to RSS Feed
- Permalink
- Report Inappropriate Content
Have you splitted the expressions between Top and bottom in the 'Position' box?
Once you have set the split axis you need to select wich expressions will go on the upper chart and wich go to the lower. If all expressions have 'Top' or all expressions have 'Bottom' it doesn't does anything
- Mark as New
- Bookmark
- Subscribe
- Mute
- Subscribe to RSS Feed
- Permalink
- Report Inappropriate Content
Don't know what you mean, if I clicked on Split Axis and select the Primary, but nothing happened. am I missing something?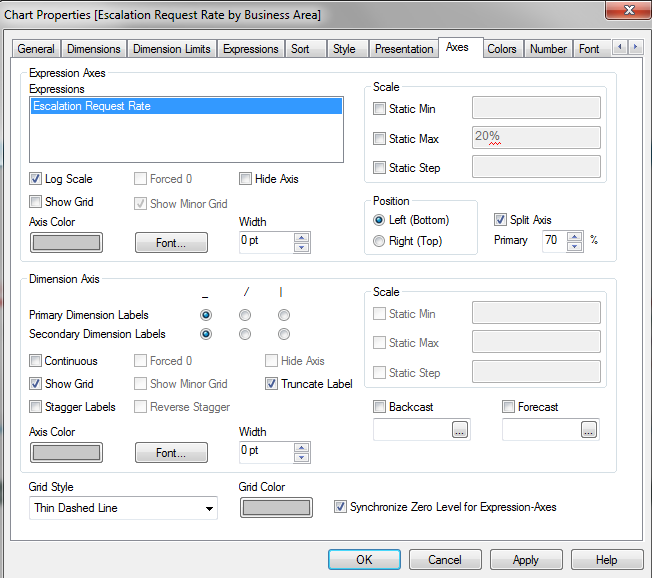
- Mark as New
- Bookmark
- Subscribe
- Mute
- Subscribe to RSS Feed
- Permalink
- Report Inappropriate Content
Ok, it won't work with only one expression. I though you had more than one, sorry for confusing you.
- « Previous Replies
-
- 1
- 2
- Next Replies »