Unlock a world of possibilities! Login now and discover the exclusive benefits awaiting you.
- Qlik Community
- :
- All Forums
- :
- QlikView App Dev
- :
- Re: Log Scale is not displaying real values
- Subscribe to RSS Feed
- Mark Topic as New
- Mark Topic as Read
- Float this Topic for Current User
- Bookmark
- Subscribe
- Mute
- Printer Friendly Page
- Mark as New
- Bookmark
- Subscribe
- Mute
- Subscribe to RSS Feed
- Permalink
- Report Inappropriate Content
Log Scale is not displaying real values
Hi,
I have a table that with the following structure:
Year-Month
Items created
Items sold
Store
So, in some months we sold the stock and not as many as we created, for example:
Store Year-Month IC IS
1 2017-01 100 25
2 2017-01 20 7
3 2017-01 55 30
1 2017-02 50 30
2 2017-02 12 15
3 2017-02 40 16
1 2017-03 110 90
2 2017-03 28 7
3 2017-03 35 30
I have created a line chart to display the percentage of sales against creation. Like the following:
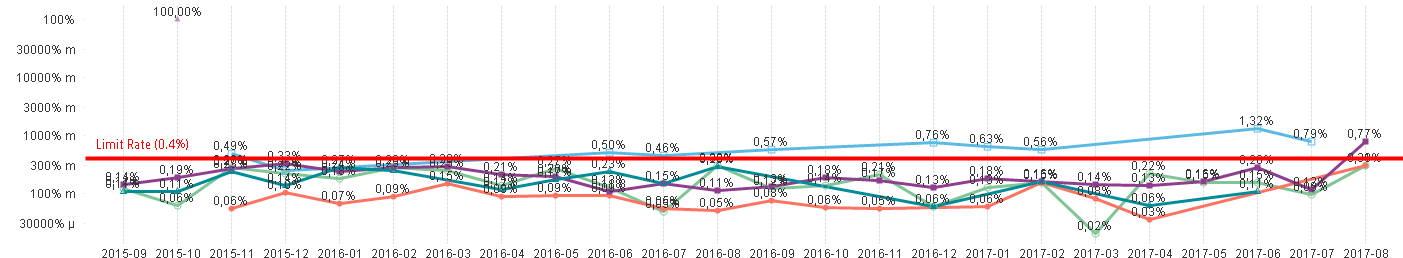
The information is displayed properly (the values are calculated IC/IS to get the percentage). The problem is with the log scale, it's not displaying correct or understandable values. If I removed the log scale I got the following:
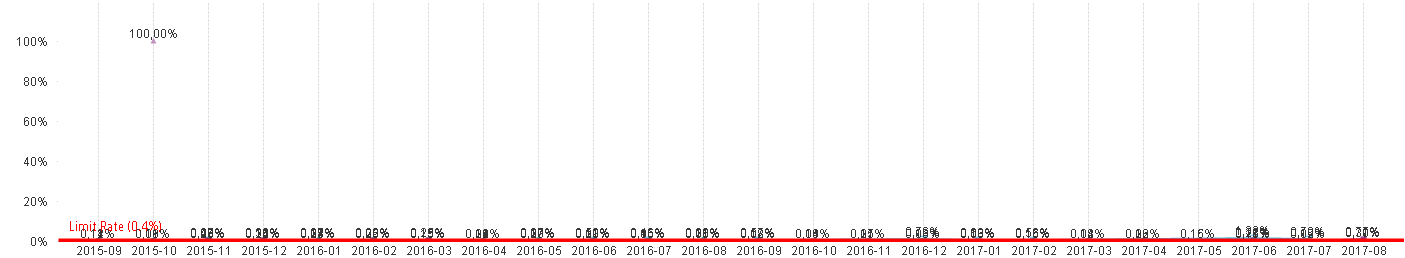
The numbers cannot be read. Is there a way to manipulate the log scale to represent the data from 0 to 10% and then the rest. I will like to see the information as the first chart but with the scale similar to the second.
Is this possible?
Thanks,
- Tags:
- log scale
- « Previous Replies
-
- 1
- 2
- Next Replies »
- Mark as New
- Bookmark
- Subscribe
- Mute
- Subscribe to RSS Feed
- Permalink
- Report Inappropriate Content
You may want to check following discussion.
If you are still having problem please include good size sample data
- Mark as New
- Bookmark
- Subscribe
- Mute
- Subscribe to RSS Feed
- Permalink
- Report Inappropriate Content
- « Previous Replies
-
- 1
- 2
- Next Replies »