Unlock a world of possibilities! Login now and discover the exclusive benefits awaiting you.
- Qlik Community
- :
- All Forums
- :
- QlikView App Dev
- :
- Making One Table from Two Tables?
- Subscribe to RSS Feed
- Mark Topic as New
- Mark Topic as Read
- Float this Topic for Current User
- Bookmark
- Subscribe
- Mute
- Printer Friendly Page
- Mark as New
- Bookmark
- Subscribe
- Mute
- Subscribe to RSS Feed
- Permalink
- Report Inappropriate Content
Making One Table from Two Tables?
I have a task to make one table box from two tables, i have sums etc all done just now struggling to embed into one, i could do something in charts but just want this to stand alone in the presentation as a table box or a table of its own in the load statement.
current output looks like below.
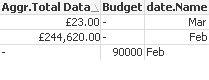
I want the 90000 budget to sit on same line as aggr.total(£244,620.00)
Script is below.
[data]:
LOAD date,
month(date)as monthcompleted,
sales
FROM
(ooxml, embedded labels, table is Sheet1);
[Aggr.Table]:
LOAD
month(date) AS [date.Name],
num(Sum(sales),'£#,##0.00') AS [Aggr.Total Data]
RESIDENT [data]
WHERE
// (Key = 0) AND
(date >= AddMonths(Today(), -12))
GROUP BY month(date);
LOAD * INLINE [
Budget, date.Name
90000, Feb
];
Thanks in advance.
- Tags:
- new_to_qlikview
Accepted Solutions
- Mark as New
- Bookmark
- Subscribe
- Mute
- Subscribe to RSS Feed
- Permalink
- Report Inappropriate Content
Overall this:
[data]:
LOAD date,
month(date)as monthcompleted,
sales
FROM
(ooxml, embedded labels, table is Sheet1);
[Aggr.Table]:
LOAD Month(date) as [date.Name],
Num(Sum(sales),'£#,##0.00') as [Aggr.Total Data]
RESIDENT [data]
WHERE
// (Key = 0) AND
(date >= AddMonths(Today(), -12))
GROUP BY month(date);
LOAD Budget,
Month(Date#(date.Name, 'MMM')) as date.Name
INLINE [
Budget, date.Name
90000, Feb
];
- Mark as New
- Bookmark
- Subscribe
- Mute
- Subscribe to RSS Feed
- Permalink
- Report Inappropriate Content
Edit your second Inline table to be this:
LOAD Budget,
Month(Date#(date.Name, 'MMM')) as date.Name
INLINE [
Budget, date.Name
90000, Feb
];
HTH
Best,
Sunny
- Mark as New
- Bookmark
- Subscribe
- Mute
- Subscribe to RSS Feed
- Permalink
- Report Inappropriate Content
Overall this:
[data]:
LOAD date,
month(date)as monthcompleted,
sales
FROM
(ooxml, embedded labels, table is Sheet1);
[Aggr.Table]:
LOAD Month(date) as [date.Name],
Num(Sum(sales),'£#,##0.00') as [Aggr.Total Data]
RESIDENT [data]
WHERE
// (Key = 0) AND
(date >= AddMonths(Today(), -12))
GROUP BY month(date);
LOAD Budget,
Month(Date#(date.Name, 'MMM')) as date.Name
INLINE [
Budget, date.Name
90000, Feb
];
- Mark as New
- Bookmark
- Subscribe
- Mute
- Subscribe to RSS Feed
- Permalink
- Report Inappropriate Content
Thanks i see now. cheers