Unlock a world of possibilities! Login now and discover the exclusive benefits awaiting you.
- Qlik Community
- :
- All Forums
- :
- QlikView App Dev
- :
- Making a table from chart data
- Subscribe to RSS Feed
- Mark Topic as New
- Mark Topic as Read
- Float this Topic for Current User
- Bookmark
- Subscribe
- Mute
- Printer Friendly Page
- Mark as New
- Bookmark
- Subscribe
- Mute
- Subscribe to RSS Feed
- Permalink
- Report Inappropriate Content
Making a table from chart data
Is there a way that I can take all the data in a chart and then use it to quickly make a table in QlikView? I have a line graph with one dimension and five expressions. The dimension consists of five dates ranging from 1/1/2018 to 1/5/2018, and the five expressions represent five data columns with fluctuating data values. Here is a screenshot of the chart: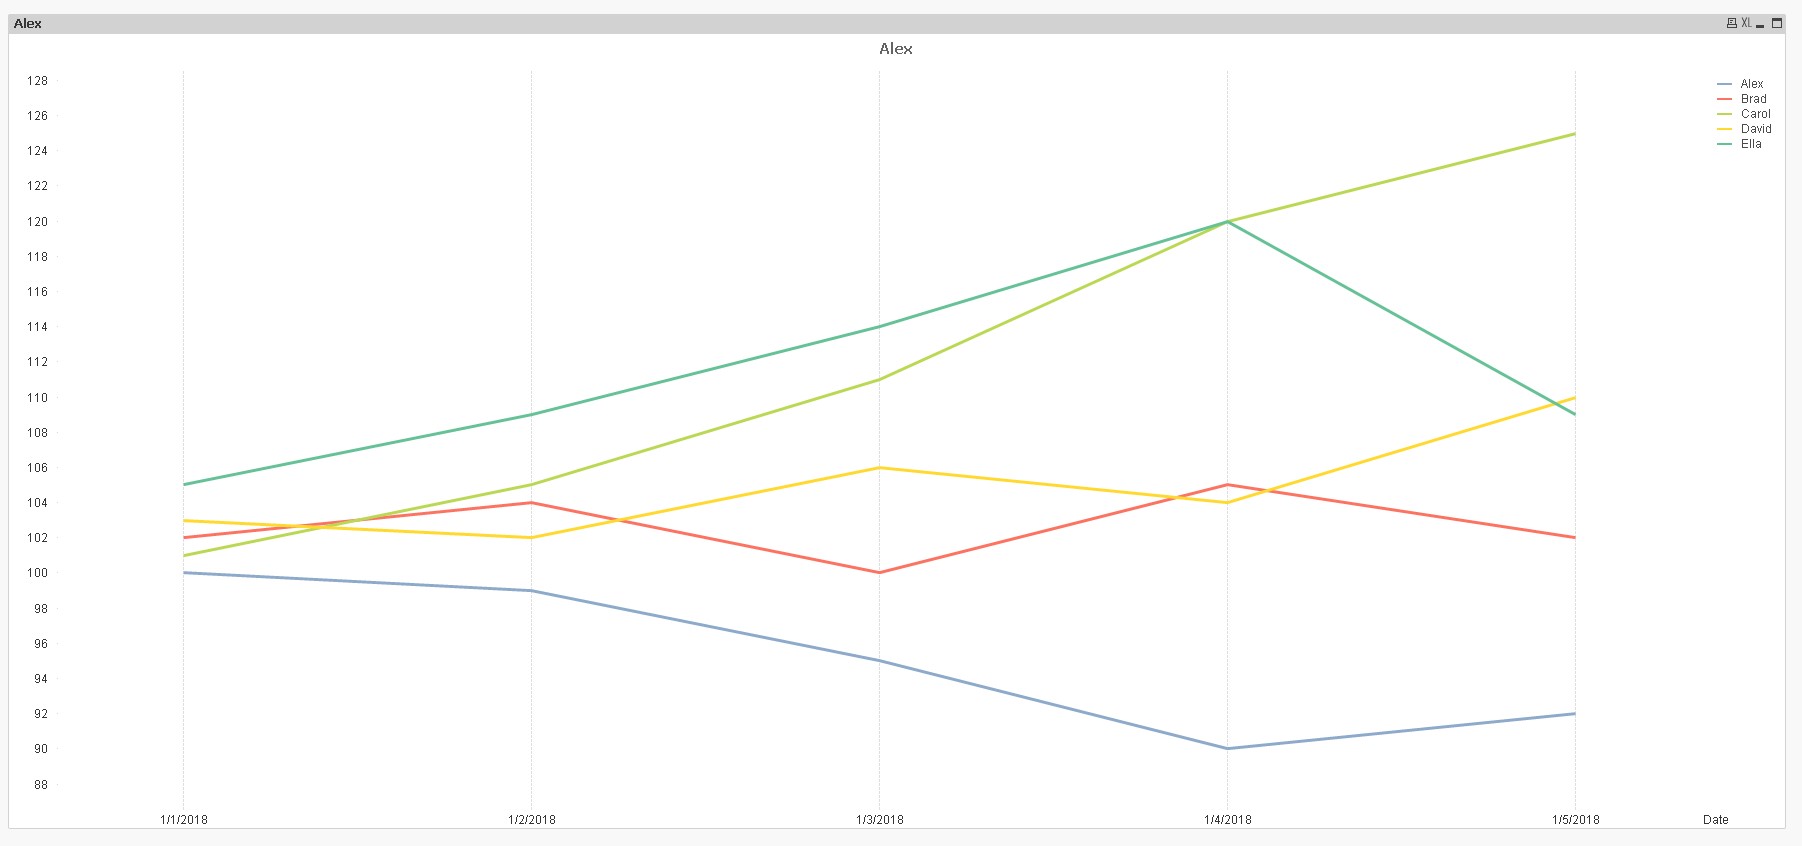
Now, I know that I can export the data into Excel, and that I can also copy the data from the chart to the Clipboard. But when I attempt to copy data to the Clipboard, for some reason the data copied to the clipboard does not include the column headers. This is not an issue when I create a table in QlikView. If I create a table in QlikView, I can copy all the data from the table into QlikView with the column headers included by selecting the "Full Table" option under "Copy To Clipboard".
What I'm asking is, can I select all the data in the chart above and use that data to make a table object in QlikView? Or, is there a way I can export all the chart data to the Clipboard with the column headers included? Any assistance anyone can provide me would be greatly appreciated.
- Mark as New
- Bookmark
- Subscribe
- Mute
- Subscribe to RSS Feed
- Permalink
- Report Inappropriate Content
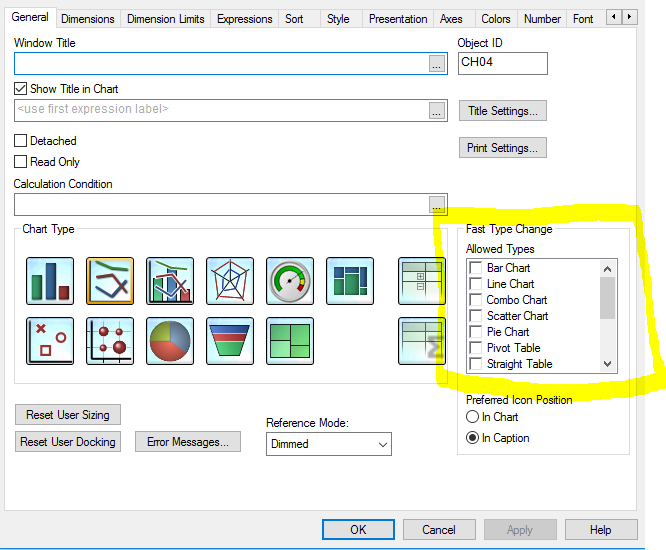
You could use Fast Change to make a table with the exact data of the graph
 t
t
Maybe that can solve your problem with the headers.
If not please share a QVW to see the problem better.
Regards,
Josefina