Unlock a world of possibilities! Login now and discover the exclusive benefits awaiting you.
- Qlik Community
- :
- All Forums
- :
- QlikView App Dev
- :
- Re: Map multiple values into one table
- Subscribe to RSS Feed
- Mark Topic as New
- Mark Topic as Read
- Float this Topic for Current User
- Bookmark
- Subscribe
- Mute
- Printer Friendly Page
- Mark as New
- Bookmark
- Subscribe
- Mute
- Subscribe to RSS Feed
- Permalink
- Report Inappropriate Content
Map multiple values into one table
I'm trying to map from multiple tables into one table, but when I do I get an SQL load statement error.
Map_Table1_Department:
Mapping SQL
Name,
Department
FROM 'Table1';
Map_Table2_Department:
Mapping SQL
Name,
Department
FROM 'Table2';
The two mapping tables load fine;
[5_EXT]:
LOAD
OrderID,
ApplyMap('Map_Table1_Department',OrderID,'') as Department,
ApplyMap('Map_Table2_Department',OrderID,'') as Department,
SQL SELECT *
FROM NewTable;
This is where I get the SQL Load error
The OrderID in the NewTable matches the Name from Table1 and Table2, but the new table doesn't have any departments, so I'm trying to map the Departments into it.
Any ideas are appreciated.
Thank you,
Accepted Solutions
- Mark as New
- Bookmark
- Subscribe
- Mute
- Subscribe to RSS Feed
- Permalink
- Report Inappropriate Content
You could also nest the mappings by putting the second mapping into the third parameter from the first mapping, like this one:
Map_Table1_Department:
Mapping SQL Select
Name,
Department
FROM 'Table1';
Map_Table2_Department:
Mapping SQL Select
Name,
Department
FROM 'Table2';
[5_EXT]:
LOAD
OrderID,
ApplyMap('Map_Table1_Department',OrderID,
ApplyMap('Map_Table2_Department',OrderID,'#NV')) as Department;
SQL SELECT *
FROM NewTable;
- Marcus
- Mark as New
- Bookmark
- Subscribe
- Mute
- Subscribe to RSS Feed
- Permalink
- Report Inappropriate Content
I noticed the following salience:
Map_Table1_Department:
Mapping SQL Select
Name,
Department
FROM 'Table1';
Map_Table2_Department:
Mapping SQL Select
Name,
Department
FROM 'Table2';
[5_EXT]:
LOAD
OrderID,
ApplyMap('Map_Table1_Department',OrderID,'') as Department1,
ApplyMap('Map_Table2_Department',OrderID,'') as Department2;
SQL SELECT *
FROM NewTable;
- Marcus
- Mark as New
- Bookmark
- Subscribe
- Mute
- Subscribe to RSS Feed
- Permalink
- Report Inappropriate Content
I had tried that, but my issue is that I'm trying to use Department as the Dimension for a chart
and when I use Department1, Department2 it doesn't represent the data the way I want
- Mark as New
- Bookmark
- Subscribe
- Mute
- Subscribe to RSS Feed
- Permalink
- Report Inappropriate Content
can you share some sample data with your expected output?
- Mark as New
- Bookmark
- Subscribe
- Mute
- Subscribe to RSS Feed
- Permalink
- Report Inappropriate Content
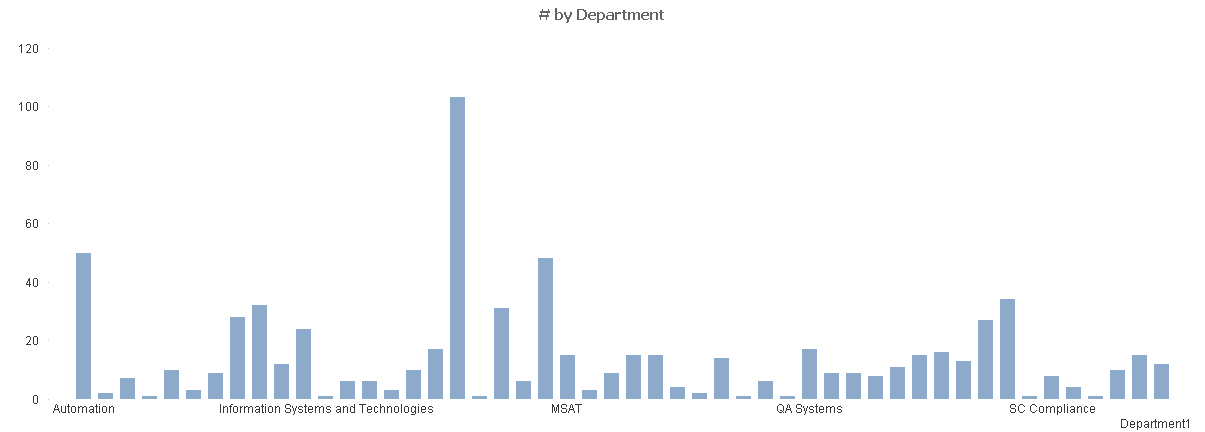
This is the graph that I want, but I need it to be based on all records otherwise these numbers won't be accurate. Using Marcus's approach above this is the reflection of Table1, Department1. In total I need to also add Table2, Department2 into one whole dimension.
Does this clarify?
- Mark as New
- Bookmark
- Subscribe
- Mute
- Subscribe to RSS Feed
- Permalink
- Report Inappropriate Content
may be try this? Extending Marcus script try like:
Map_Table1_Department:
Mapping SQL Select
Name,
Department
FROM 'Table1';
Map_Table2_Department:
Mapping SQL Select
Name,
Department
FROM 'Table2';
Table1:
LOAD
OrderID,
ApplyMap('Map_Table1_Department',OrderID,'') as Department;
SQL SELECT *
FROM NewTable;
Concatenate(Table1)
Table1:
LOAD
OrderID,
ApplyMap('Map_Table2_Department',OrderID,'') as Department;
SQL SELECT *
FROM NewTable;
- Mark as New
- Bookmark
- Subscribe
- Mute
- Subscribe to RSS Feed
- Permalink
- Report Inappropriate Content
You could also nest the mappings by putting the second mapping into the third parameter from the first mapping, like this one:
Map_Table1_Department:
Mapping SQL Select
Name,
Department
FROM 'Table1';
Map_Table2_Department:
Mapping SQL Select
Name,
Department
FROM 'Table2';
[5_EXT]:
LOAD
OrderID,
ApplyMap('Map_Table1_Department',OrderID,
ApplyMap('Map_Table2_Department',OrderID,'#NV')) as Department;
SQL SELECT *
FROM NewTable;
- Marcus