Unlock a world of possibilities! Login now and discover the exclusive benefits awaiting you.
- Qlik Community
- :
- All Forums
- :
- QlikView App Dev
- :
- Re: Maximum value for Y-axis
- Subscribe to RSS Feed
- Mark Topic as New
- Mark Topic as Read
- Float this Topic for Current User
- Bookmark
- Subscribe
- Mute
- Printer Friendly Page
- Mark as New
- Bookmark
- Subscribe
- Mute
- Subscribe to RSS Feed
- Permalink
- Report Inappropriate Content
Maximum value for Y-axis
Hi community,
I use the following expression in my chart:
Delivery_relevant_date - only({<[Bezeichnung DLZ]={'Assessment'}>}[Start Vorgang])
Now I would like to set the maximum to 500. But if max value is for example is only 100 it should scale to 100.
I tried several possibilities in the chart properties for static max...but I don't get it to work
I appreciate any help.
Best Regards,
Peter
- Mark as New
- Bookmark
- Subscribe
- Mute
- Subscribe to RSS Feed
- Permalink
- Report Inappropriate Content
Hi,
In chart properties -> Axes -> Scale-> Static Max
Give your expression - Max(MeasureName)
Regards,
jagan.
- Mark as New
- Bookmark
- Subscribe
- Mute
- Subscribe to RSS Feed
- Permalink
- Report Inappropriate Content
Hi jagan,
thank you for your reply.
I dont get what you mean with Max(MeasureName) ?
I want something like the following
IF Delivery_relevant_date - only({<[Bezeichnung DLZ]={'Assessment'}>}[Start Vorgang])) > 500 than 500 else
Delivery_relevant_date - only({<[Bezeichnung DLZ]={'Assessment'}>}[Start Vorgang])
- Mark as New
- Bookmark
- Subscribe
- Mute
- Subscribe to RSS Feed
- Permalink
- Report Inappropriate Content
Hi,
Give this expression in
In chart properties -> Axes -> Scale-> Static Max
If(only({<[Bezeichnung DLZ]={'Assessment'}>}[Start Vorgang]) > 500, 500,
only({<[Bezeichnung DLZ]={'Assessment'}>}[Start Vorgang]))
Regards,
Jagan.
- Mark as New
- Bookmark
- Subscribe
- Mute
- Subscribe to RSS Feed
- Permalink
- Report Inappropriate Content
Typically you will need an Aggr statement for doing this. To build on Jagan's expression:
=If(max(aggr(Delivery_relevant_date - only({<[Bezeichnung DLZ]={'Assessment'}>}[Start Vorgang]), [Your Dimensions])) > 500, 500,
max(aggr(Delivery_relevant_date - only({<[Bezeichnung DLZ]={'Assessment'}>}[Start Vorgang]), [Your Dimensions])) * 1.1)
The multiply by 1.1 is to allow a bit of space above the max point - or it can look like the line is off the top of the scale. You can adjust that number to suit.
If you search for AGGR you will find lots of information on the Community and elsewhere on line.
Hope that helps,
Steve
- Mark as New
- Bookmark
- Subscribe
- Mute
- Subscribe to RSS Feed
- Permalink
- Report Inappropriate Content
Sorry this didn't work,
I calculate the difference between 2 dates, so the formula gives as result number of days for each order.
X-Axis = Orders
And in my chart I have 2-3 exceptions which have 1000 days as result, which destroys my axis scale...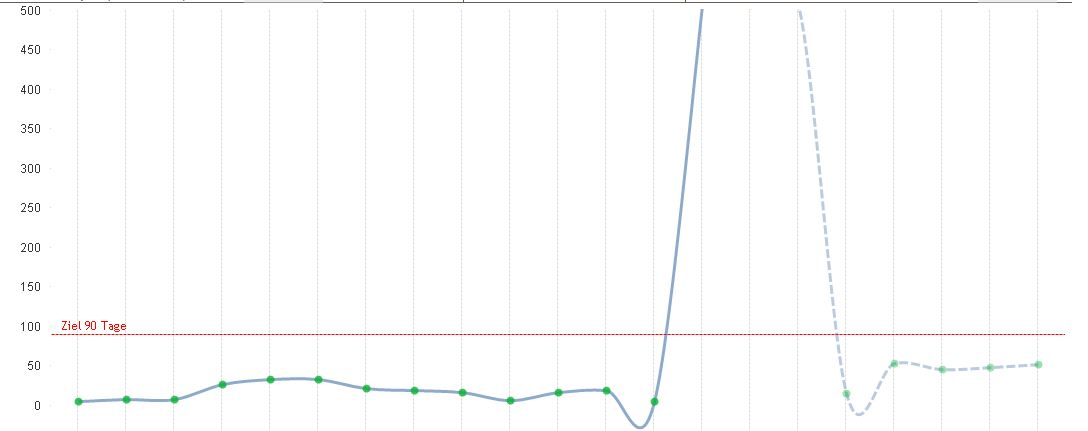
Or in other Words, I want to ignore values higher than 500 for scaling my chart...
- Mark as New
- Bookmark
- Subscribe
- Mute
- Subscribe to RSS Feed
- Permalink
- Report Inappropriate Content
You will always hit that problem if your average data is < 50 with a few outliers of 1000, i.e. 20 times greater. You could use a log scale, but you'd have to be clear in showing that you're doing so.