Unlock a world of possibilities! Login now and discover the exclusive benefits awaiting you.
- Qlik Community
- :
- All Forums
- :
- QlikView App Dev
- :
- Merge and split header in straight table
- Subscribe to RSS Feed
- Mark Topic as New
- Mark Topic as Read
- Float this Topic for Current User
- Bookmark
- Subscribe
- Mute
- Printer Friendly Page
- Mark as New
- Bookmark
- Subscribe
- Mute
- Subscribe to RSS Feed
- Permalink
- Report Inappropriate Content
Merge and split header in straight table
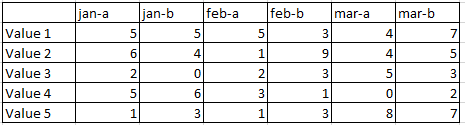
I have straight table with two expressions for each month resulting in 24 expressions sample of resultant view is below
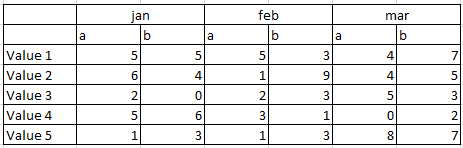
I'm trying to obtain the as shown below
Thank you in advance community.
- Mark as New
- Bookmark
- Subscribe
- Mute
- Subscribe to RSS Feed
- Permalink
- Report Inappropriate Content
Use calculated dimensions
1) SubField(Month, '-', 1)
2) SubField(Month, '-', 2)
- Mark as New
- Bookmark
- Subscribe
- Mute
- Subscribe to RSS Feed
- Permalink
- Report Inappropriate Content
Can you share application?
- Mark as New
- Bookmark
- Subscribe
- Mute
- Subscribe to RSS Feed
- Permalink
- Report Inappropriate Content
Value1, Value2, Value2... is from one dimension. and there is two expression for each month
- Mark as New
- Bookmark
- Subscribe
- Mute
- Subscribe to RSS Feed
- Permalink
- Report Inappropriate Content
Not sure I understand...
- Mark as New
- Bookmark
- Subscribe
- Mute
- Subscribe to RSS Feed
- Permalink
- Report Inappropriate Content
Sorry about that Sunny. Let me try to make it clearer here. So I have a straight table where i have selected one field as a dimension and in expressions field i have 24 expressions. This produced a view like the first one in my post. Now I was trying to merge the Label as shown in the second image.
- Mark as New
- Bookmark
- Subscribe
- Mute
- Subscribe to RSS Feed
- Permalink
- Report Inappropriate Content
Not sure how your data looks like, but you should be able to get the above view using pivot table with 2 or 3 dimensions. You might need to get in synthetic dimensions, but it would be difficult to say much without seeing the raw data
- Mark as New
- Bookmark
- Subscribe
- Mute
- Subscribe to RSS Feed
- Permalink
- Report Inappropriate Content
hi Naveen,
Did you solve this problem ?