Unlock a world of possibilities! Login now and discover the exclusive benefits awaiting you.
- Qlik Community
- :
- All Forums
- :
- QlikView App Dev
- :
- Re: Migration Matrix in Qlikview
Options
- Subscribe to RSS Feed
- Mark Topic as New
- Mark Topic as Read
- Float this Topic for Current User
- Bookmark
- Subscribe
- Mute
- Printer Friendly Page
Turn on suggestions
Auto-suggest helps you quickly narrow down your search results by suggesting possible matches as you type.
Showing results for
Master II
2016-09-14
03:20 AM
- Mark as New
- Bookmark
- Subscribe
- Mute
- Subscribe to RSS Feed
- Permalink
- Report Inappropriate Content
Migration Matrix in Qlikview
Hi All,
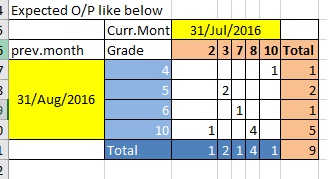
I have requirement like Matrix layout output, how to achieve this in qlikview? Thanks
| Source file | ||
|---|---|---|
| Date | Customer | Rating |
| 31/08/2016 | A | 10 |
| 31/08/2016 | B | 10 |
| 31/08/2016 | C | 5 |
| 31/08/2016 | D | 5 |
| 31/08/2016 | E | 10 |
| 31/08/2016 | F | 10 |
| 31/08/2016 | G | 10 |
| 31/08/2016 | H | 4 |
| 31/08/2016 | I | 6 |
| 31/07/2016 | A | 8 |
| 31/07/2016 | B | 2 |
| 31/07/2016 | C | 3 |
| 31/07/2016 | D | 3 |
| 31/07/2016 | E | 8 |
| 31/07/2016 | F | 8 |
| 31/07/2016 | G | 8 |
| 31/07/2016 | H | 10 |
| 31/07/2016 | I | 7 |
| Note: | ||||||||
| Grade | customer count | |||||||
| Previous Month | always show the previous month as top of the migration matrix e.x: 31/Jul/2016 | |||||||
| Current Month | Current month to be shown in left of the matrix e.x: 31/Aug/2016 | |||||||
Thanks dev
763 Views
1 Solution
Accepted Solutions
MVP
2016-09-14
01:05 PM
- Mark as New
- Bookmark
- Subscribe
- Mute
- Subscribe to RSS Feed
- Permalink
- Report Inappropriate Content
656 Views
2 Replies
2016-09-14
11:54 AM
- Mark as New
- Bookmark
- Subscribe
- Mute
- Subscribe to RSS Feed
- Permalink
- Report Inappropriate Content
Would you provide application.
OR Do transpose after creating PIVOT
Best Anil, When applicable please mark the correct/appropriate replies as "solution" (you can mark up to 3 "solutions". Please LIKE threads if the provided solution is helpful
656 Views
MVP
2016-09-14
01:05 PM
- Mark as New
- Bookmark
- Subscribe
- Mute
- Subscribe to RSS Feed
- Permalink
- Report Inappropriate Content
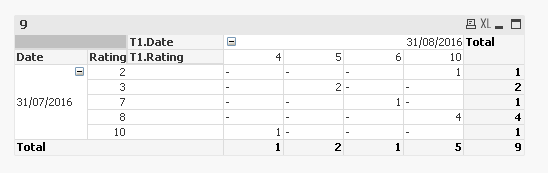
Like this?
657 Views