Unlock a world of possibilities! Login now and discover the exclusive benefits awaiting you.
- Qlik Community
- :
- All Forums
- :
- QlikView App Dev
- :
- Re: Min or Max of a calculated expression
- Subscribe to RSS Feed
- Mark Topic as New
- Mark Topic as Read
- Float this Topic for Current User
- Bookmark
- Subscribe
- Mute
- Printer Friendly Page
- Mark as New
- Bookmark
- Subscribe
- Mute
- Subscribe to RSS Feed
- Permalink
- Report Inappropriate Content
Min or Max of a calculated expression
Hello,
I have been struggling too long so I ask for your kind help.
My goal is to fill in a variable with the max of the following expression. I need to get a single value at the end.
I have a table with 2 columns
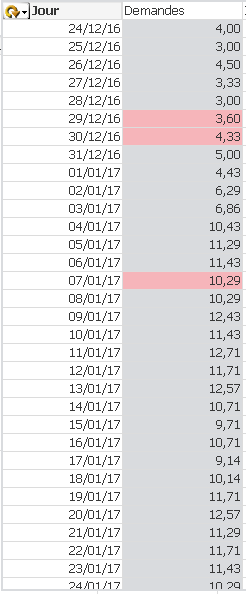
dimension: it'a cyclical group with the first dimension equal to Jour=Date(date_occ-(year(date_occ)-v_AnneeRef)*364,'DD/MM/YY')
It is used to compare equivalent day between different years. A monday with a monday A tuesday with a tuesday etc
So I have several date_occ already aggregated under each "jour"
Expressions:
Demande: =($(vExpr_nombrededemandes))/count(DISTINCT{$< statut_option= , statut_affaire={"*"}> } ANNEE_OCCUPATION)
vExpr_nombrededemandes= (Count({$< libel_segment={"*"}-{'Salles expos/orgas'}-{'Autres'}, statut_option= , statut_affaire={"*"}-{'IMMOBIL'}>} DISTINCT mot_directeur) )
Thanks a lot
- Mark as New
- Bookmark
- Subscribe
- Mute
- Subscribe to RSS Feed
- Permalink
- Report Inappropriate Content
I think the problem is that you will need to use Aggr() function with the chart dimension to reach the output... but because your dimension is a calculated dimension... you cannot use it within Aggr() function
- Mark as New
- Bookmark
- Subscribe
- Mute
- Subscribe to RSS Feed
- Permalink
- Report Inappropriate Content
If I fix my dimension and so don't use the hierarchical group. You would have a solution?
- Mark as New
- Bookmark
- Subscribe
- Mute
- Subscribe to RSS Feed
- Permalink
- Report Inappropriate Content
Hierarchial group is not a problem, calculated dimension behind the hierarchical group is.
- Mark as New
- Bookmark
- Subscribe
- Mute
- Subscribe to RSS Feed
- Permalink
- Report Inappropriate Content
Hello,
I followed your advice and I don't use anymore a calculated dimension behind the hierarchical group.
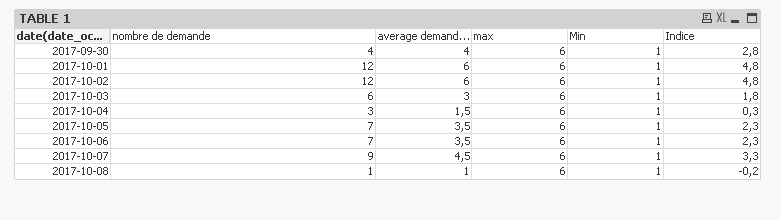
I added equivalent date thanks to an other table.You will found it in sample 2
The result I expect for the table 1 is 12 is it possible?
To put more context the goal at the end is to build an index so I will have to do
(p - pmin / (pmin-pmax)
All my value will range between 0 and 1
thank you
- Mark as New
- Bookmark
- Subscribe
- Mute
- Subscribe to RSS Feed
- Permalink
- Report Inappropriate Content
This gives me 12
=Max(Aggr(($(vExpr_nombrededemandes)), [date(date_occ_equiv_2017, 'YYYY-MM-DD')]))
- Mark as New
- Bookmark
- Subscribe
- Mute
- Subscribe to RSS Feed
- Permalink
- Report Inappropriate Content
Thanks for the super fast answer I am gonna check that on the real model
Thanks
- Mark as New
- Bookmark
- Subscribe
- Mute
- Subscribe to RSS Feed
- Permalink
- Report Inappropriate Content
I actually wanted to get 6 since I am looking for the max of the average per day but I did sucess on my own.
Nevertheless I still have a little issue.
The variable indeed contains the max so 6. and the min is 1, but in the "table 1" the max and the min are changing depending on the days. I want them to be fix. In order to make my "indice" between 0 and 1
I added a new sample
Should I use a set analysis or something?
- Mark as New
- Bookmark
- Subscribe
- Mute
- Subscribe to RSS Feed
- Permalink
- Report Inappropriate Content
Try this
=Max(TOTAL Aggr(($(vExpr_nombrededemandes)/(count(DISTINCT{$< statut_option= , statut_affaire={"*"}> } ANNEE_OCCUPATION))), [date(date_occ_equiv_2017, 'YYYY-MM-DD')]))
=Min(TOTAL Aggr(($(vExpr_nombrededemandes)/(count(DISTINCT{$< statut_option= , statut_affaire={"*"}> } ANNEE_OCCUPATION))), [date(date_occ_equiv_2017, 'YYYY-MM-DD')]))
- Mark as New
- Bookmark
- Subscribe
- Mute
- Subscribe to RSS Feed
- Permalink
- Report Inappropriate Content
We are really close,
Does TOTAL exclude all the set analysis I put in m formula?
In my real model value are changing when I add some filters they shoudlnt.
- Mark as New
- Bookmark
- Subscribe
- Mute
- Subscribe to RSS Feed
- Permalink
- Report Inappropriate Content
TOTAL doesn't exclude set analysis.... can you share by an image as to what happens with set analysis add in?