Unlock a world of possibilities! Login now and discover the exclusive benefits awaiting you.
- Qlik Community
- :
- All Forums
- :
- QlikView App Dev
- :
- Re: Mini Bar Chart - Can you Rag Colour??
- Subscribe to RSS Feed
- Mark Topic as New
- Mark Topic as Read
- Float this Topic for Current User
- Bookmark
- Subscribe
- Mute
- Printer Friendly Page
- Mark as New
- Bookmark
- Subscribe
- Mute
- Subscribe to RSS Feed
- Permalink
- Report Inappropriate Content
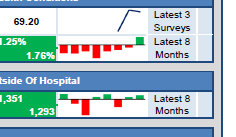
Mini Bar Chart - Can you Rag Colour??
Hi All
Can you RAG colour a Mini Bar Chart?
Also if you can - Can the Rag be based on differing Target values per Row?
i.e.
Row 1 target> 2=Green, Red,
Row 2 >1500=Green, Red.
I havent found a way of Rag the rows at all yet and am needing tofind how to do this ASAP
Many Thanks In Advance
Jo
- Mark as New
- Bookmark
- Subscribe
- Mute
- Subscribe to RSS Feed
- Permalink
- Report Inappropriate Content
got to expression tab in the chart properties> click on the + mark on the expression >click on the background color
here if(sign(sum(amount)=-1,RED(),GREEN())
- Mark as New
- Bookmark
- Subscribe
- Mute
- Subscribe to RSS Feed
- Permalink
- Report Inappropriate Content
Hi Thankyou for your reply
This isnt working for me they are all coming back as Green- its as if its assessing the overall RAG for the expression but not per month in the mini chart for the individual row data
Can you post a working example please?
- Mark as New
- Bookmark
- Subscribe
- Mute
- Subscribe to RSS Feed
- Permalink
- Report Inappropriate Content
Sorry, I was think in the actual bar chart . Your trying it in the min chart ok, can you post you app will check