Unlock a world of possibilities! Login now and discover the exclusive benefits awaiting you.
- Qlik Community
- :
- All Forums
- :
- QlikView App Dev
- :
- Re: Missing value
- Subscribe to RSS Feed
- Mark Topic as New
- Mark Topic as Read
- Float this Topic for Current User
- Bookmark
- Subscribe
- Mute
- Printer Friendly Page
- Mark as New
- Bookmark
- Subscribe
- Mute
- Subscribe to RSS Feed
- Permalink
- Report Inappropriate Content
Missing value
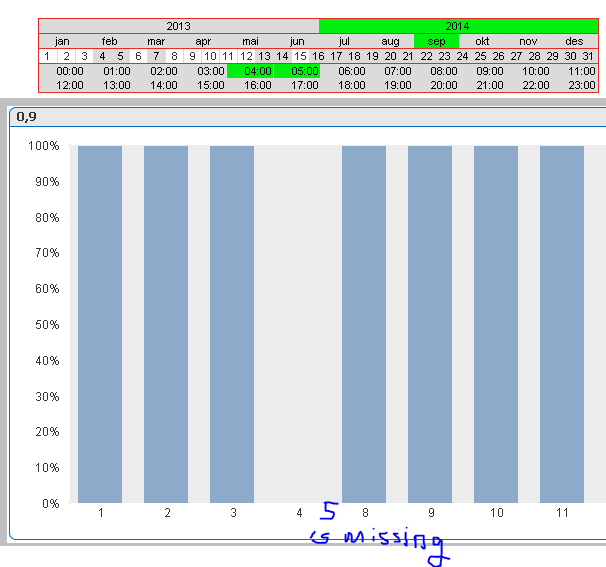
We use an expression to check whether a particular or multiple reports have been updated in a given time interval. We have created a cyclic group with the Day, Week and Month dimensions. The expression below works properly when we select multiple reports and displays the total number of reports updated in the given time interval. However, there's a problem when only selecting one report that hasn't been updated at all, at a given day. Then that day is omitted from the chart and when calculating weekly percentage updated reports the day without updates is omitted.
=SUM(aggr(COUNT({$<Year = {"$(#=Max(Year))"},WeekDay -= {'sat', 'sun'}>}DISTINCT QVD_Id),Month,LoadDay))/(COUNT({$<WeekDay -= {'sat', 'sun}, Time=,Day=>} Month)*GetSelectedCount(QVD_Id))
For example, as you see in the image below, when we select one report with the following time intervals, it does not show a value of zero for "5" - which is a Friday. It shows zero for "4" and that is because the report was updated after 5am but on Friday the 5th there was no update. We want the chart to show a value of zero for Friday as well.
Hope you can help us! Appreciate it!
- Mark as New
- Bookmark
- Subscribe
- Mute
- Subscribe to RSS Feed
- Permalink
- Report Inappropriate Content
Hi,
Just check the option show all values in presentation tab.
Regards
Rohit
- Mark as New
- Bookmark
- Subscribe
- Mute
- Subscribe to RSS Feed
- Permalink
- Report Inappropriate Content
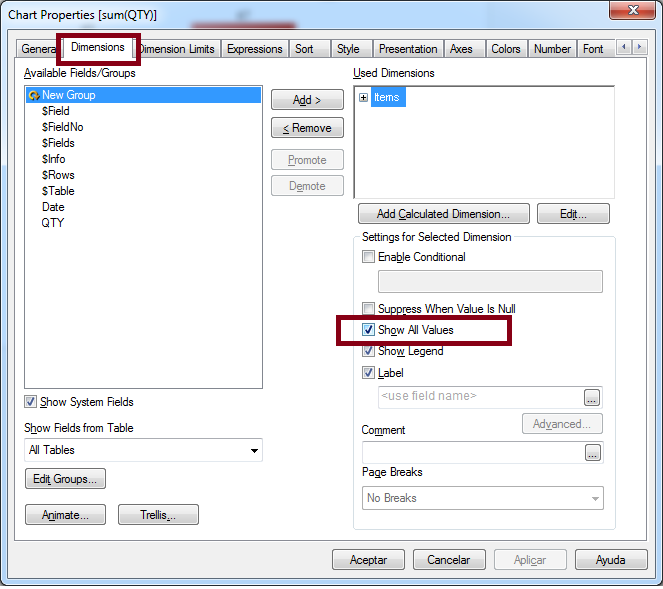
Just in case, check that the value 5 exists on your data for that dimension. If it's there, check the box "show all values" from the Dimension tab on the properties of the chart:
- Mark as New
- Bookmark
- Subscribe
- Mute
- Subscribe to RSS Feed
- Permalink
- Report Inappropriate Content
Hi Jose,
Thanks for the suggestion however we have already checked this option. We know that 5 exists, but we are more concerned about our expression and whether it disables values like September 5th (that have null values) to appear on the chart.
Thanks again for the suggestion 😃
- Mark as New
- Bookmark
- Subscribe
- Mute
- Subscribe to RSS Feed
- Permalink
- Report Inappropriate Content
Thanks you but we have already checked this option. We know that 5 exists, but we are more concerned about our expression and whether it disables values like September 5th (that have null values) to appear on the chart.