Unlock a world of possibilities! Login now and discover the exclusive benefits awaiting you.
- Qlik Community
- :
- All Forums
- :
- QlikView App Dev
- :
- Re: Modify Timestamp in Example: Files for creatio...
- Subscribe to RSS Feed
- Mark Topic as New
- Mark Topic as Read
- Float this Topic for Current User
- Bookmark
- Subscribe
- Mute
- Printer Friendly Page
- Mark as New
- Bookmark
- Subscribe
- Mute
- Subscribe to RSS Feed
- Permalink
- Report Inappropriate Content
Modify Timestamp in Example: Files for creation of a Gannt Chart
Regrading to the great example form Henric Conström : Files for creation of a Gannt Chart - unfortunately I was not able to comment this example.
Does anyone know who I can change the code, if the format for the date is for example Sep 15 2015 10:23:10.345.678 (Month Day Year hh:mm:ss:ff)
I'm not able to get the right timeline in the Chart. The format in the example ist yyyy-mm-dd.
It would be great, if someone has an idea to do this.
- Mark as New
- Bookmark
- Subscribe
- Mute
- Subscribe to RSS Feed
- Permalink
- Report Inappropriate Content
If you want to change your date to YYYY-MM-DD you can try this:
Date(Floor(TimeStampField), 'YYYY-MM-DD')
- Mark as New
- Bookmark
- Subscribe
- Mute
- Subscribe to RSS Feed
- Permalink
- Report Inappropriate Content
Hello,
i tested the following expresssion:
Let vtest = Date(Floor('Sep 12 2015 10:23:10.123.345'),'YYYY-MM-DD');
but I didn't get any result.
What I want to use the Date and the Timestamp for the timeline in the chart.
- Mark as New
- Bookmark
- Subscribe
- Mute
- Subscribe to RSS Feed
- Permalink
- Report Inappropriate Content
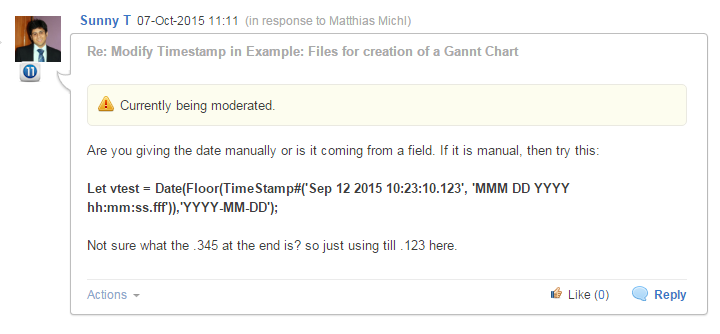
Are you giving the date manually or is it coming from a field. If it is manual, then try this:
Let vtest = Date(Floor(TimeStamp#('Sep 12 2015 10:23:10.123', 'MMM DD YYYY hh:mm:ss.fff')),'YYYY-MM-DD');
Not sure what the .345 at the end is? so just using till .123 here.
- Mark as New
- Bookmark
- Subscribe
- Mute
- Subscribe to RSS Feed
- Permalink
- Report Inappropriate Content
- Mark as New
- Bookmark
- Subscribe
- Mute
- Subscribe to RSS Feed
- Permalink
- Report Inappropriate Content
Hello,
i tried it again without any success
I got the date and Time with the following two format:
Sep 15 2015 10:23:10.345.678
15.09.2015 10:23:10.345.678
the timestamp is in the xml which I want to import.
I want to create a graph with the complete timestamp on x-axis, because the data is form more than one day. Because of this I need the date an the time with the milliseconds.
I have no ideas how i can do this. I have already tried your code, but i doesn't work.
I got no numerical Values on x-axis in the chart.