Unlock a world of possibilities! Login now and discover the exclusive benefits awaiting you.
- Qlik Community
- :
- All Forums
- :
- QlikView App Dev
- :
- Re: Month field format varying in source and Qlikv...
- Subscribe to RSS Feed
- Mark Topic as New
- Mark Topic as Read
- Float this Topic for Current User
- Bookmark
- Subscribe
- Mute
- Printer Friendly Page
- Mark as New
- Bookmark
- Subscribe
- Mute
- Subscribe to RSS Feed
- Permalink
- Report Inappropriate Content
Month field format varying in source and Qlikview
Hello Everyone,
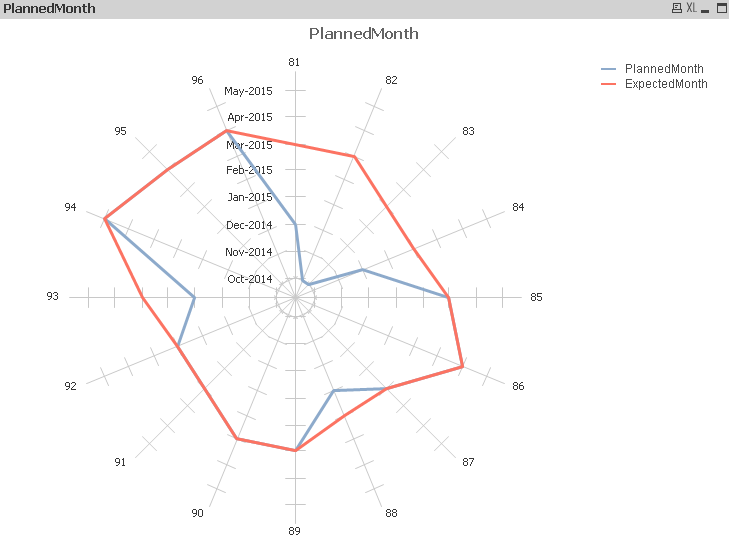
I have a month field in excel which ive custom formatted to MMM-YY, but when I double click on it in the cell the value displayed is in the format DD-MM-YYYY. When I use this field in Radar(Spider) charts expression the chart display numbers like 1900,1920,1940,1960...
When is use the field like Month(Field) then the values are 0,2,4,6,8.... When is use the field like MonthName(Field) then the values are 10000, 20000, 30000....
I want the chart to display the values As Jan-14,Feb-14.... Jan-15,Feb-15...
Any help would be highly appreciated.
Thanks,
Pratik
- « Previous Replies
- Next Replies »
- Mark as New
- Bookmark
- Subscribe
- Mute
- Subscribe to RSS Feed
- Permalink
- Report Inappropriate Content
Hi Pratik,
First do in scripting, take separately months by using subfield(without Year).
In Dimension tab you will put PlannedMonth or ExpectedMonth or Month and in expression tab put Sum(SelectedResource). Then it will work.
- Mark as New
- Bookmark
- Subscribe
- Mute
- Subscribe to RSS Feed
- Permalink
- Report Inappropriate Content
Hi
You need to modify your Dimensions & Expressions.
You've used them in a Wrong manner.
Kindly correct them and plot the Chart in a Right way.
Solution just to show the desired Result:
Instead of using Month(PlannedDate) use only Planneddate field and made changes in the Number Tab.
See the Snapshot:
Also, check the Attachment.
Regards
Av7eN
- Mark as New
- Bookmark
- Subscribe
- Mute
- Subscribe to RSS Feed
- Permalink
- Report Inappropriate Content
Thanks.After making those changes in Number tab I was still getting the same 4 digit numbers.
When I unchecked Forced 0 in Axes Tab i Got the desired output.
- « Previous Replies
- Next Replies »