Unlock a world of possibilities! Login now and discover the exclusive benefits awaiting you.
- Qlik Community
- :
- All Forums
- :
- QlikView App Dev
- :
- Re: Month on Month Comparison.
- Subscribe to RSS Feed
- Mark Topic as New
- Mark Topic as Read
- Float this Topic for Current User
- Bookmark
- Subscribe
- Mute
- Printer Friendly Page
- Mark as New
- Bookmark
- Subscribe
- Mute
- Subscribe to RSS Feed
- Permalink
- Report Inappropriate Content
Month on Month Comparison.
Hi All,
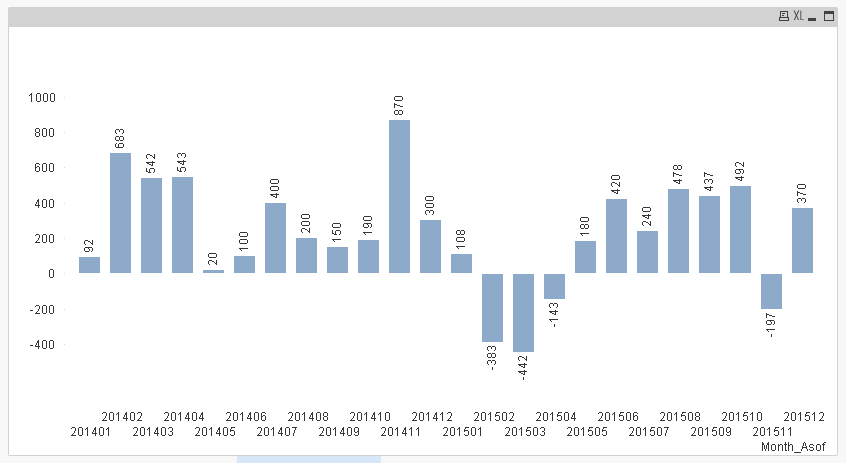
I need to create a bar chart which shows the Month on Month added value.Ie.
The dimension would be MonthYear.
in Expression let say for 2015-12 it should show the sales which has been added compared to 2014-12,
sales(2015-12)-sales(2014-12) should be the added value for 2015-12.
How can i achieve the same.
Please suggest.
Regards,
Reena
- « Previous Replies
-
- 1
- 2
- Next Replies »
- Mark as New
- Bookmark
- Subscribe
- Mute
- Subscribe to RSS Feed
- Permalink
- Report Inappropriate Content
I think there is no info about 2013. What would you want to see for 2014? the actual numbers?
- Mark as New
- Bookmark
- Subscribe
- Mute
- Subscribe to RSS Feed
- Permalink
- Report Inappropriate Content
For all years, may be this:
RangeSum(Sum(Sales), - Above(sum(Sales), Count(DISTINCT TOTAL {<Year={'$(=max(Year))'}>} Month_Asof)))
- Mark as New
- Bookmark
- Subscribe
- Mute
- Subscribe to RSS Feed
- Permalink
- Report Inappropriate Content
Or this for all years - first year in your data (because for first year you won't have any difference)
RangeSum(Sum({<Year -={'$(=min(Year))'}>}Sales), -Above(sum(Sales), Count(DISTINCT TOTAL {<Year={'$(=max(Year))'}>} Month_Asof)))
- Mark as New
- Bookmark
- Subscribe
- Mute
- Subscribe to RSS Feed
- Permalink
- Report Inappropriate Content
Error in expression
- Mark as New
- Bookmark
- Subscribe
- Mute
- Subscribe to RSS Feed
- Permalink
- Report Inappropriate Content
Hi Sunny,
It is working.. 
But if i have 1 more year data let say for 2013 then for 2013 it will show the same data.not the difference.
if i am limiting the data for 2 years in dimension.then for 2014 it will be showing the same value for 2014 not the difference.
And also if i need to add 1 more dimension "Type' then the expression wont Work.. 
Any suggestions ?
Regards,
Reena
- Mark as New
- Bookmark
- Subscribe
- Mute
- Subscribe to RSS Feed
- Permalink
- Report Inappropriate Content
Hi Reena,
Try using this :
RangeSum(Sum({<Year={$(=max(Year))}>}SALES), - Above(Sum({<Year={$(=max(Year)-1)}>}SALES), Count(DISTINCT TOTAL {<Year={'$(=max(Year))'}>} Month_AsOf)))
+ RangeSum(Sum({<Year={$(=max(Year)-1)}>}SALES), - Above(Sum({<Year={$(=max(Year)-2)}>}SALES), Count(DISTINCT TOTAL {<Year={'$(=max(Year))'}>} Month_AsOf)))
And for each type create different expressions eg Type={'ABC'}
Regards
KC
KC
- Mark as New
- Bookmark
- Subscribe
- Mute
- Subscribe to RSS Feed
- Permalink
- Report Inappropriate Content
Can you share data for 2013? I think this formula I just gave you should show you difference for 2014 and 2015 if you have 2013, 2014 and 2015 years in your database.
- Mark as New
- Bookmark
- Subscribe
- Mute
- Subscribe to RSS Feed
- Permalink
- Report Inappropriate Content
Thanks Jyothish. ... Its working.. 
- Mark as New
- Bookmark
- Subscribe
- Mute
- Subscribe to RSS Feed
- Permalink
- Report Inappropriate Content
Can any1 help me with a expression that compares current and past month of same year
eg: nov 2019 comparison with oct 2019
- « Previous Replies
-
- 1
- 2
- Next Replies »