Unlock a world of possibilities! Login now and discover the exclusive benefits awaiting you.
- Qlik Community
- :
- All Forums
- :
- QlikView App Dev
- :
- Month wise count mismatch
- Subscribe to RSS Feed
- Mark Topic as New
- Mark Topic as Read
- Float this Topic for Current User
- Bookmark
- Subscribe
- Mute
- Printer Friendly Page
- Mark as New
- Bookmark
- Subscribe
- Mute
- Subscribe to RSS Feed
- Permalink
- Report Inappropriate Content
Month wise count mismatch
hi,
I have master calendar showing year, month and date.
If I select 2017 and feb it is showing as below chart:
chart-1
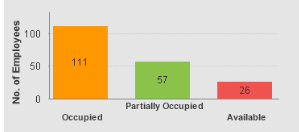
total count must be:117 only but it is showing for 194.
If I select 2017 and feb with particular date means it is showing correct count as given below:
eg:01/02/2017
chart-2
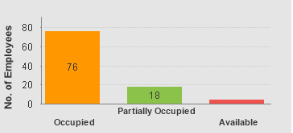
It is showing the correct count for 98.
Can any one help me how to achieve the correct count for monthly wise also..........
regards,
Yoganantha Prakash G.P
- « Previous Replies
-
- 1
- 2
- Next Replies »
- Mark as New
- Bookmark
- Subscribe
- Mute
- Subscribe to RSS Feed
- Permalink
- Report Inappropriate Content
It is based on the worked hours of the employee sunny,
If he worked
02/01/2017,100, 8(worked hours) , Occupied
02/02/2017,100,4(worked hours), Available
when we select Feb 2017 he must be Partially Occupied (8+4)/(2(no.of dates)) = 6 as per requirement
- Mark as New
- Bookmark
- Subscribe
- Mute
- Subscribe to RSS Feed
- Permalink
- Report Inappropriate Content
But here 6 is the number of hours and you are not showing number of hours in your chart. You are showing the number of people in each of the group, right? You want to show 3/4th employee in Occupied and 1/4th in Available?
- Mark as New
- Bookmark
- Subscribe
- Mute
- Subscribe to RSS Feed
- Permalink
- Report Inappropriate Content
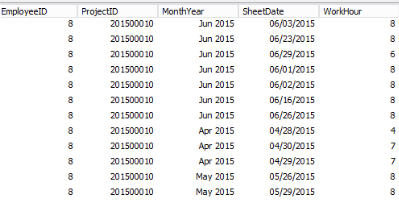
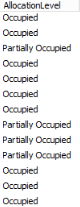
In the above image employee 8 works in the above days in different hours based on the hours its allocation level is showing for each day. but When I select month and year in master calendar it is counting each number of occupied count and available count for him and displays the count with duplicate.
- Mark as New
- Bookmark
- Subscribe
- Mute
- Subscribe to RSS Feed
- Permalink
- Report Inappropriate Content
I want to show the employee count only in the chart ......
For particular day wise it is counting correctly. As you mentioned the categoires duplicate and its count also duplicate how to restrict it
- Mark as New
- Bookmark
- Subscribe
- Mute
- Subscribe to RSS Feed
- Permalink
- Report Inappropriate Content
That's what I am trying to understand. If you have this data
FieldName, Date, EmployeeNumber
Occupied, 02/01/2017, 100
Available, 02/02/2017, 100
Occupied, 02/02/2017, 100
and you select Feb 2017. What will the chart look like?
- Mark as New
- Bookmark
- Subscribe
- Mute
- Subscribe to RSS Feed
- Permalink
- Report Inappropriate Content
The allocation is based on the worked hours. So if I select year and month only means the sum of worked hours in month must be calculated automatically and is allocation level must be freezed example:Occupied.
Then in Occupied bar the count must be 1.
- Mark as New
- Bookmark
- Subscribe
- Mute
- Subscribe to RSS Feed
- Permalink
- Report Inappropriate Content
My bad, this is the example I wanted to use
02/01/2017,100, 8(worked hours) , Occupied
02/02/2017,100,4(worked hours), Available
02/02/2017,100,4(worked hours), Occupied
In Feb, Employee number 100 was available for 4 hours and occupied for 12 hours. He would only show up in occupied? why? because he was more occupied then available? (12 vs 4 hours)
If the data looked like this, he would be counted in available now?
02/01/2017,100, 8(worked hours) , Available
02/02/2017,100,4(worked hours), Occupied
02/02/2017,100,4(worked hours), Available
- Mark as New
- Bookmark
- Subscribe
- Mute
- Subscribe to RSS Feed
- Permalink
- Report Inappropriate Content
Please post a sample application so people here can help you better
Preparing examples for Upload - Reduction and Data Scrambling
If a post helps to resolve your issue, please accept it as a Solution.
- « Previous Replies
-
- 1
- 2
- Next Replies »