Unlock a world of possibilities! Login now and discover the exclusive benefits awaiting you.
- Qlik Community
- :
- All Forums
- :
- QlikView App Dev
- :
- Monthly percentage change in a chart?
- Subscribe to RSS Feed
- Mark Topic as New
- Mark Topic as Read
- Float this Topic for Current User
- Bookmark
- Subscribe
- Mute
- Printer Friendly Page
- Mark as New
- Bookmark
- Subscribe
- Mute
- Subscribe to RSS Feed
- Permalink
- Report Inappropriate Content
Monthly percentage change in a chart?
Can anyone tell me how I can show the change from the start month in a chart based on the WTE data only. I can do this easily in excel.
My MS Excel example is below :
| WTE | Percent_Change (Calculated field) |
| 1,200.59 | |
| 1,204.74 | 0.35% |
| 1,207.96 | 0.61% |
| 1,221.05 | 1.70% |
| 1,244.07 | 3.62% |
| 1,248.28 | 3.97% |
| 1,252.55 | 4.33% |
| 1,266.43 | 5.48% |
| 1,266.71 | 5.51% |
| 1,268.42 | 5.65% |
| 1,281.08 | 6.70% |
| 1,280.68 | 6.67% |
| 1,272.56 | 5.99% |
| 1,263.48 | 5.24% |
| 1,249.60 | 4.08% |
| 1,250.70 | 4.17% |
| 1,240.24 | 3.30% |
| 1,232.57 | 2.66% |
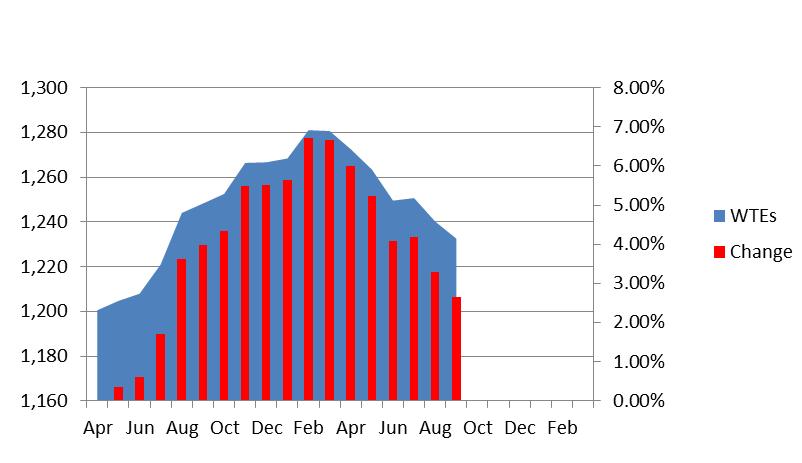
I want to show the percentage and the current WTE(Example below) :
Thanks
Phil
Accepted Solutions
- Mark as New
- Bookmark
- Subscribe
- Mute
- Subscribe to RSS Feed
- Permalink
- Report Inappropriate Content
Heya Phil,
Here are two examples in one app:
1. Using a calculated field in the script to create the WTE change % as a field in your data model.
or
2. Calculate the WTE change % on the fly in the chart using the Above() interrecord function.
- Mark as New
- Bookmark
- Subscribe
- Mute
- Subscribe to RSS Feed
- Permalink
- Report Inappropriate Content
Hi Phil,
Yes. It can be achieved by using the below expression.
=(WTE-top(only(WTE)))/top( only(WTE))*100
Thanks.
- Mark as New
- Bookmark
- Subscribe
- Mute
- Subscribe to RSS Feed
- Permalink
- Report Inappropriate Content
Heya Phil,
Here are two examples in one app:
1. Using a calculated field in the script to create the WTE change % as a field in your data model.
or
2. Calculate the WTE change % on the fly in the chart using the Above() interrecord function.
- Mark as New
- Bookmark
- Subscribe
- Mute
- Subscribe to RSS Feed
- Permalink
- Report Inappropriate Content
Hi Phil,
see below an easy to create chart which comes close to your needs:
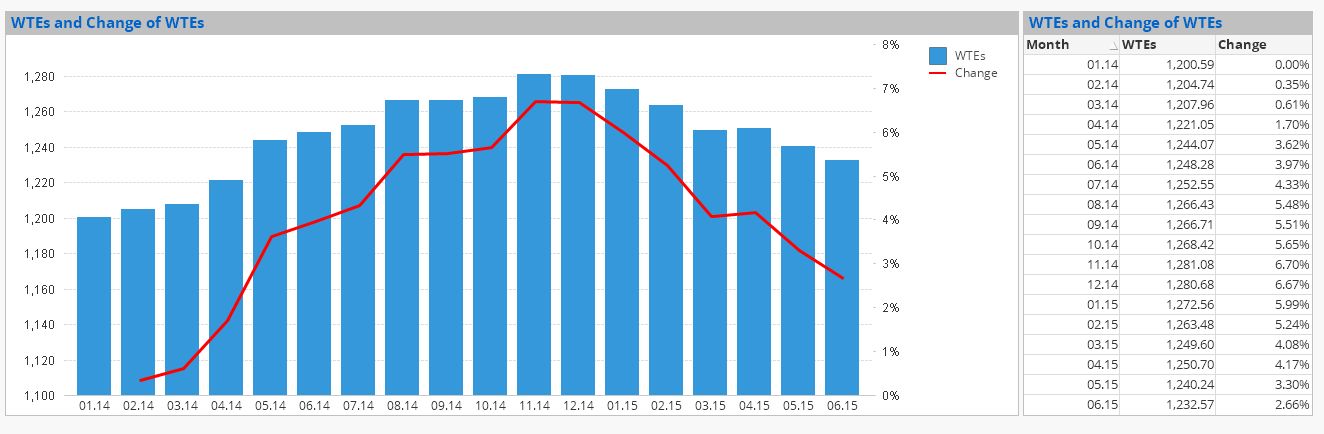
You have to use a Combo Chart with month as dimension and expression Sum(WTE) as bar chart. Expression Sum(WTE) / 1200.59 - 1 as line chart. Second axis is for %.
Hope this helps.
Burkhard