Unlock a world of possibilities! Login now and discover the exclusive benefits awaiting you.
- Qlik Community
- :
- All Forums
- :
- QlikView App Dev
- :
- Moving Data over Time period.
- Subscribe to RSS Feed
- Mark Topic as New
- Mark Topic as Read
- Float this Topic for Current User
- Bookmark
- Subscribe
- Mute
- Printer Friendly Page
- Mark as New
- Bookmark
- Subscribe
- Mute
- Subscribe to RSS Feed
- Permalink
- Report Inappropriate Content
Moving Data over Time period.
Hi guys, I have a problem which I am really strugling to even start, so I have a ticketing system database which I already have all the data for it, now I have a requirement for a Line Chart that shows me the Non-Closed and Not on Hold ticket count for the last 48 hours, this will obviously be reloaded frequently on the server and keep updating the line graph, the fields I have are the following.
| Ticket | ChangeDate | Status | Change |
|---|---|---|---|
| 123 | 09/09/2014 12:00 | Open | Ticket Open |
| 123 | 09/09/2014 14:00 | Open | Change1 |
| 123 | 10/09/2014 11:00 | Closed | Closed |
| 456 | 09/09/2014 12:00 | Open | Ticket Open |
| 456 | 09/09/2014 17:00 | On Hold | Change1 |
| 456 | 09/09/2014 17:20 | Open | Change2 |
| 789 | 03/09/2014 09:23 | Open | Ticket Open |
| 789 | 04/09/2014 12:00 | Open | Change1 |
| 789 | 09/09/2014 13:00 | Open | Change2 |
| 789 | 09/09/2014 13:10 | Open | Change3 |
| 457 | 09/09/2014 11:10 | Open | Ticket Open |
| 457 | 09/09/2014 15:15 | Open | Change1 |
| 457 | 09/09/2014 17:50 | Open | Change2 |
| 457 | 09/09/2014 22:03 | Open | Change3 |
Now Obviously, this data might change, for example in 5 minutes Ticket Number 457 might get closed.
Any help will be greatly appreciated.
- Mark as New
- Bookmark
- Subscribe
- Mute
- Subscribe to RSS Feed
- Permalink
- Report Inappropriate Content
Hi.
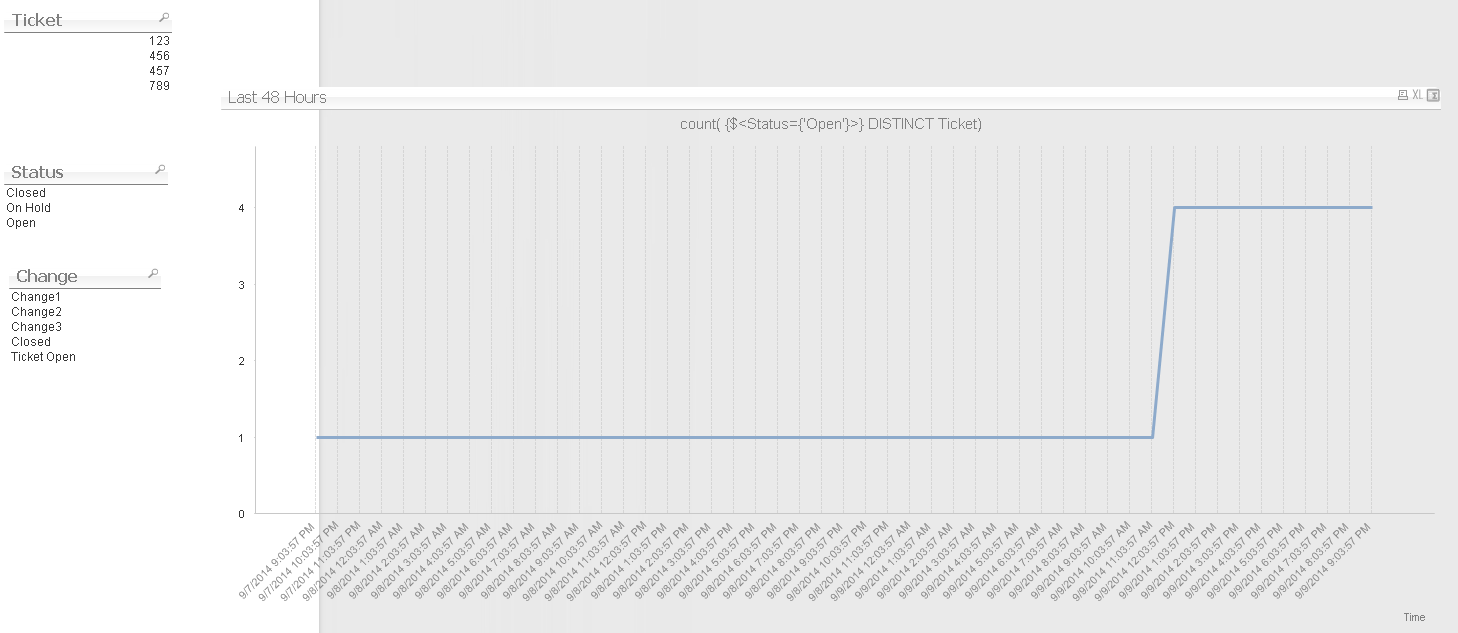
Here is an attempted solution that uses a Time table that dynamically calculates 48 records denoting the last 48 hours in 1 hour increments and then uses an intervalmatch to figure out which tickets were open during each of the previous 48 hours
 ]
]
The load script is:
Tickets:
LOAD Ticket,
ChangeDate,
now() as CurrentDate,
Status,
Change
FROM
(ooxml, embedded labels, table is Sheet1);
Last48Hours:
load
timestamp(now() - interval(Interval#( RecNo()-1 & ':' & '00', 'hh:mm'))) as Time
AutoGenerate 49;
Intervals:
IntervalMatch (Time) LOAD ChangeDate, CurrentDate Resident Tickets;
- Mark as New
- Bookmark
- Subscribe
- Mute
- Subscribe to RSS Feed
- Permalink
- Report Inappropriate Content
Hi, thanks for your help, but it seems this solution keeps on adding results, I added some data to the table from 2010, 2011 etc and these show up in the graph.
On my real data im starting with 20.000 Tickets, If you build a Table with the results from your script the Dimension "Time" fill the whole table for all years and all times with a Date from the previous 48 hours.
- Mark as New
- Bookmark
- Subscribe
- Mute
- Subscribe to RSS Feed
- Permalink
- Report Inappropriate Content
It also seems never to deduct numbers, they keep getting added, and the line never drops so for the following Data.
| Ticket | ChangeDate | Status | Change |
| 1 | 09/09/2014 09:03 | Open | Ticket Open |
| 1 | 09/09/2014 10:05 | Open | Change |
| 2 | 09/09/2014 09:10 | Open | Ticket Open |
| 2 | 09/09/2014 10:10 | Closed | Closed |
| 3 | 09/09/2014 11:20 | Open | Ticket Open |
| 4 | 09/09/2014 11:20 | Open | Ticket Open |
| 5 | 09/09/2014 11:25 | Open | Ticket Open |
| 6 | 09/09/2014 11:29 | Open | Ticket Open |
| 3 | 09/09/2014 14:20 | Closed | Closed |
| 4 | 09/09/2014 14:20 | Closed | Closed |
| 5 | 09/09/2014 14:25 | Closed | Closed |
| 6 | 09/09/2014 14:29 | Closed | Closed |
From 9:00 to 10:00 the count should be 2. Ticket 1 and 2 are open.
From 10:00 to 11:00 the count should be 1. As Ticket number 1 is still open but ticket number 2 was closed.
From 11:00 to 12:00 the count should be 5. Ticket 1 is still open and tickets 3,4,5,6 were created.
From 12:00 to 13:00 5.
From 13:00 to 14:00 5.
From 14:00 to 15:00 1. Tickets 3,4,5,6 were closed but Ticket 1 is still open.
Many Thanks
- Mark as New
- Bookmark
- Subscribe
- Mute
- Subscribe to RSS Feed
- Permalink
- Report Inappropriate Content
Correct. The sequential nature what not taken into account. I'll take another look soon
- Mark as New
- Bookmark
- Subscribe
- Mute
- Subscribe to RSS Feed
- Permalink
- Report Inappropriate Content
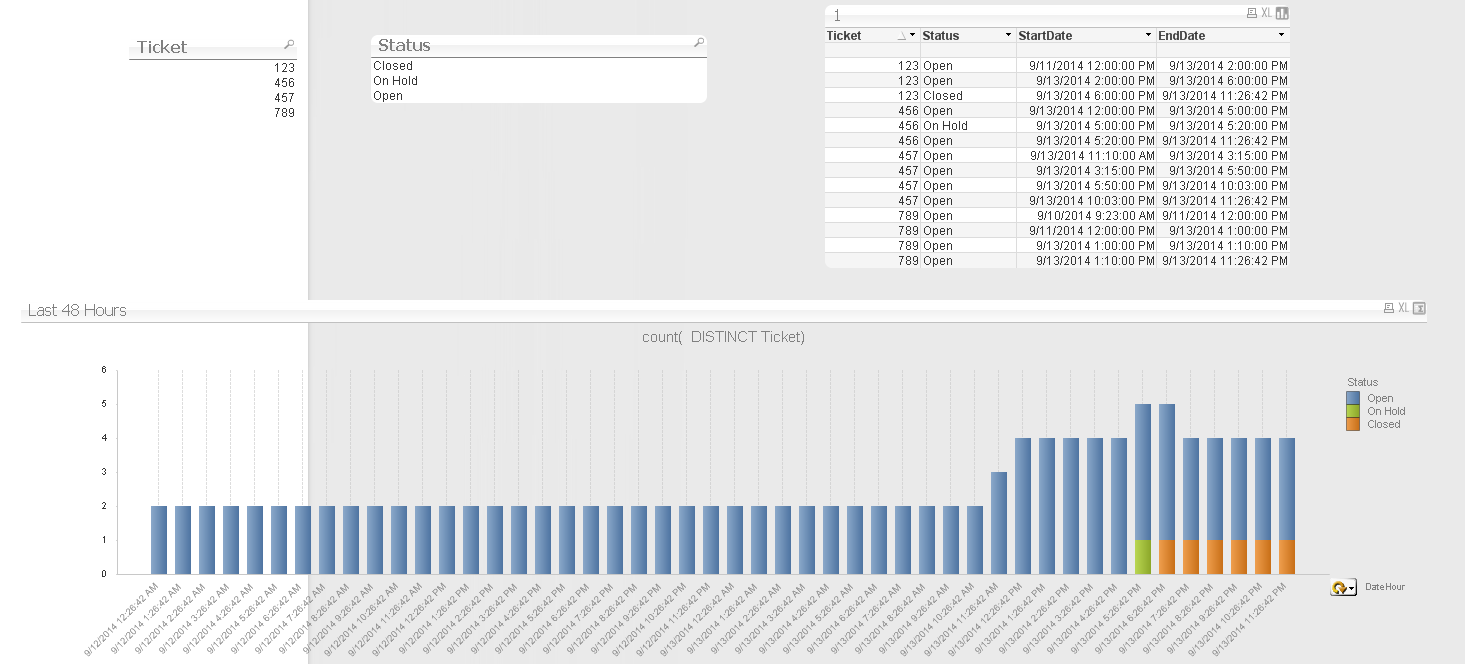
Okay. Here is another attempt.
In the load i am switching the structure into a list of ' Ticket Statuses' with starts and end dates. This is different than the format in the data source which is a list of 'Ticket status changes' with change dates.
I believe this sets the data up well for an intervalmatch on a dynamic 48 hour calendar table (for the last 48 hours).
Couple things:
- I'm not sure about your date format in the real data source so there may need to be some formatting in the qlik script to adapt
- the 48 hour calendar goes down to the second. you can cycle from date to hour to minute to actual time
- the chart will work for all status types, not just open. Just select open to see the chart you were looking for to show only open cases.
- Mark as New
- Bookmark
- Subscribe
- Mute
- Subscribe to RSS Feed
- Permalink
- Report Inappropriate Content
Hi Jonatham thank you very much for all the time you have lost with my problem.
I will test it at work tomorrow, and get some feedback.
Once again many thanks.