Unlock a world of possibilities! Login now and discover the exclusive benefits awaiting you.
- Qlik Community
- :
- All Forums
- :
- QlikView App Dev
- :
- Multi-line chart with an average line
- Subscribe to RSS Feed
- Mark Topic as New
- Mark Topic as Read
- Float this Topic for Current User
- Bookmark
- Subscribe
- Mute
- Printer Friendly Page
- Mark as New
- Bookmark
- Subscribe
- Mute
- Subscribe to RSS Feed
- Permalink
- Report Inappropriate Content
Multi-line chart with an average line
Hello friends,
I need to create a multiline chart with an average line for the following data.
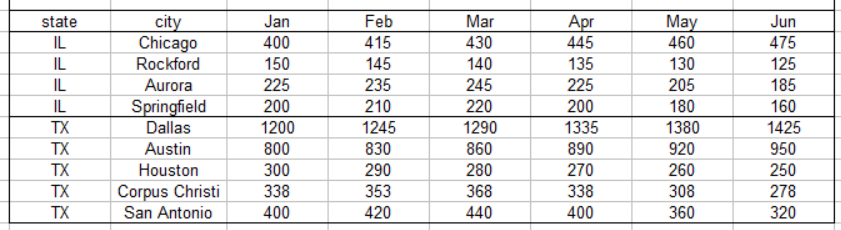
If a state with n cities is selected, the chart should display monthly sales trend for each city in that state and an additional (n+1)th line showing the average monthly sales trend of the n cities. (For example, if IL is selected, the multiline chart will have five lines, one for each city and the fifth line showing the monthly average sales of the four cities.)
I have data in a table in four fields: state, city, month,sales.
What are the dimensions and expression(s) to be defined for the chart?. Appreciate any help in achieving this.
- Tags:
- chart
Accepted Solutions
- Mark as New
- Bookmark
- Subscribe
- Mute
- Subscribe to RSS Feed
- Permalink
- Report Inappropriate Content
I see.
Can you try replacing the getfieldselections with this:
'$(=concat(distinct city, chr(39) & ', ' & chr(39)))'
- Mark as New
- Bookmark
- Subscribe
- Mute
- Subscribe to RSS Feed
- Permalink
- Report Inappropriate Content
Hi,
Check Marco Wedel's answer in this thread:
- Mark as New
- Bookmark
- Subscribe
- Mute
- Subscribe to RSS Feed
- Permalink
- Report Inappropriate Content
Thank you for your response.
I did go through Marco Wedel's post and would have used the solution, if I were to start with selection of cities. As I have to select state in my case and display lines for cities, the use of GetFieldSelections() is not an option.
- Mark as New
- Bookmark
- Subscribe
- Mute
- Subscribe to RSS Feed
- Permalink
- Report Inappropriate Content
I see.
Can you try replacing the getfieldselections with this:
'$(=concat(distinct city, chr(39) & ', ' & chr(39)))'
- Mark as New
- Bookmark
- Subscribe
- Mute
- Subscribe to RSS Feed
- Permalink
- Report Inappropriate Content
Thank you. It worked.