Unlock a world of possibilities! Login now and discover the exclusive benefits awaiting you.
- Qlik Community
- :
- All Forums
- :
- QlikView App Dev
- :
- Re: Multidimensional running totals when there are...
- Subscribe to RSS Feed
- Mark Topic as New
- Mark Topic as Read
- Float this Topic for Current User
- Bookmark
- Subscribe
- Mute
- Printer Friendly Page
- Mark as New
- Bookmark
- Subscribe
- Mute
- Subscribe to RSS Feed
- Permalink
- Report Inappropriate Content
Multidimensional running totals when there aren't values for all combinations
!I'd appreciate any help the Community could provide for this situation.
I am looking to display running totals for a calculation that requires details from a specific granularity. Because of this, I am using AGGR and the appropriate fields. I understand that I need to utilize the RANGESUM and ABOVE functions but run into trouble when data doesn't exist for every combination of my aggregated dimensions.
The expression is: sum(Numerator) / sum(Denominator)
Here is the data I'm using to illustrate my issue:
LOAD * Inline
[
Period,Month,Category,Type,Detail, Denominator,Numerator, Other
Period 2014-2015,1,Apple,County,misc 01,125, 3 ,0.075
Period 2014-2015,1,Apple,County,misc 02,125, 3 ,0.075
Period 2014-2015,1,Banana,County,misc 06,115, 1 ,0.07
Period 2014-2015,2,Banana,County,misc 14,120, 4 ,0.07
Period 2014-2015,3,Apple,County,misc 17,130, 2 ,0.075
Period 2014-2015,3,Banana,County,misc 20,120, 5 ,0.07
Period 2014-2015,3,Banana,County,misc 21,120, 2 ,0.07
Period 2014-2015,1,Apple,Local,misc 03,115, 5 ,0.05
Period 2014-2015,1,Banana,Local,misc 07,130, 1 ,0.05
Period 2014-2015,1,Banana,Local,misc 08,115, 5 ,0.05
Period 2014-2015,2,Apple,Local,misc 10,120, 3 ,0.05
Period 2014-2015,2,Banana,Local,misc 15,135, 5 ,0.05
Period 2014-2015,3,Apple,Local,misc 18,110, 4 ,0.05
Period 2014-2015,3,Banana,Local,misc 22,135, 1 ,0.05
Period 2014-2015,3,Banana,Local,misc 23,135, 2 ,0.05
Period 2014-2015,1,Apple,National,misc 04,100, 2 ,0.15
Period 2014-2015,1,Apple,National,misc 05,110, 2 ,0.15
Period 2014-2015,1,Banana,National,misc 09,105, 1 ,0.1
Period 2014-2015,2,Apple,National,misc 11,115, 3 ,0.15
Period 2014-2015,2,Apple,National,misc 12,105, 1 ,0.15
Period 2014-2015,2,Apple,National,misc 13,110, 4 ,0.15
Period 2014-2015,2,Banana,National,misc 16,125, 2 ,0.1
Period 2014-2015,3,Apple,National,misc 19,110, 2 ,0.15
Period 2014-2015,3,Banana,National,misc 24,125, 2 ,0.1
Period 2014-2015,3,Banana,National,misc 25,125, 1 ,0.1
];
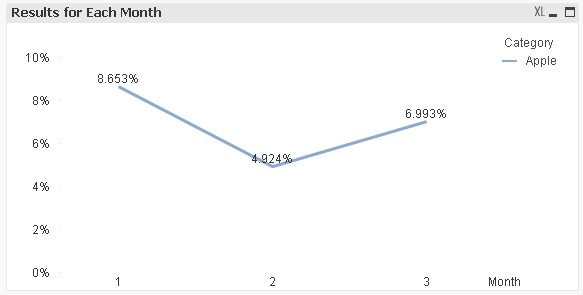
This line chart shows (correctly) the month-by-month calculated results for "Apple":

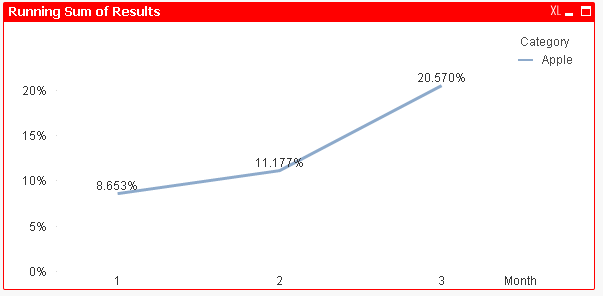
This next line chart shows my efforts at a running sum, but is incorrect for Month 2. I think it's because there is no County data for "Apple" in Month 2:

Here is the expression I attempted to build:
sum(aggr(rangesum(above( sum(Numerator) / sum(Denominator),0,RowNo(TOTAL))),Period,Category,Type,Month))
I'm including the QVW file if that will help. The "Banana" category works as expected. Again, I suspect this is because there is data for all types (Local, County, and National) in all months.
Thanks in advance for the great ideas!!
Eric
Message was edited by: Eric Wissner to reflect issues that exist even after Clark's suggestion below. Thinking through it more, I wonder if the whole "Type" dimension is getting nulled out in the AGGR because it's trying to divide by zero in those months where there are no County types? This would maybe explain why Month 2's result above (11.177%) is equal to the correct result when I only select Local and National types.
- Mark as New
- Bookmark
- Subscribe
- Mute
- Subscribe to RSS Feed
- Permalink
- Report Inappropriate Content
Does this yield the expected results?
sum(aggr(rangesum(above( sum(Qty * (Price + Price * Tax)),0,RowNo(TOTAL))),Period,Category,Month))
- Mark as New
- Bookmark
- Subscribe
- Mute
- Subscribe to RSS Feed
- Permalink
- Report Inappropriate Content
Clark, Thanks for the quick reply. It does make that expression work, but unfortunately, I'm not having success applying it to my specific situation. I thought I had replicated the situation/issue well in my question, but obviously hadn't. Sorry about that.
I alluded to it in the OP, but I need to maintain/sum the results of the expression at a level that still includes Type. My real-life expression is a division statement and we're adding the ratios that are returned for each Category and Type within each Period.
I'm going to try and upload another version of my example app that hopefully better illustrates my issue. If I simply remove "Type" from my AGGR statement, it isn't returning the correct granularity for the ratios that need added.
Thanks again. !
- Mark as New
- Bookmark
- Subscribe
- Mute
- Subscribe to RSS Feed
- Permalink
- Report Inappropriate Content
Hi,
Were you able to find the solution, I have similar issue and the below solution doesn't work.
I have simple equation to display cumulated number of employees added each month to different departments.
When sometimes, the data for a department is 0, it doesn't add up or display the previous month's number on that month, resulting in inconsistencies.
Could anyone please help me?
Thanks
- Mark as New
- Bookmark
- Subscribe
- Mute
- Subscribe to RSS Feed
- Permalink
- Report Inappropriate Content
It's mainly a question of the available dataset because each interrecord-logic takes the specified range of rows/columns around the calling source. There is no general approach how zeros and/or wrong and/or missing values could be handled - because not only the datasets and the applied data-models will have an impact else also the view-requirements and which results are expected as correct respectively as wanted.
In nearly all scenarios it would be most sensible to populate missing records within the data-model as well as cleaning/correcting any values which aren't regarded as valid. If after all considerations and efforts missing and/or unwanted values remains you will need some extra information providing you the variances against the default-logic, for example a separate period-counter which resolves missing periods or maybe appropriate offset-values for the interrecord-functions including more/less rows around the calling source and/or starting/ending on another row.
The cause is always an incomplete dataset and a solution could be very hard to reach. In each case it would be easier to come to working approaches by adjusting the dataset/data-model as trying to resolve those lack within the UI because this is mostly too complicated -nesting more as two aggr() and using n nested if-loops to fetch all needed combinations - and even if it worked the performance might get too bad as to be acceptable.
- Mark as New
- Bookmark
- Subscribe
- Mute
- Subscribe to RSS Feed
- Permalink
- Report Inappropriate Content
@marcus_sommer Thanks for your reply.
Actually, In my case the values are not null/Period Missing. Let me demonstrate an example:
For Bar Chart-
Dimensions:
- Period =Month(Period) & '-' & Year(Period)
- Department
Measure:
- Employee Count - Aggr(RangeSum(Above(Sum([New Employees Count]), 0, RowNo())),Department,(Period, NUMERIC))
I need the full sum as: 73 for the period Mar 2023 instead of: 67
What is happening:
As for the period :Mar 2023, there is no entry for department 'HelpDesk', so it not appearing in that period in cumulated Sums as well.
I am attaching the used data set here for reference.
Can this be resolved in any way?
Thanks in advance.
- Mark as New
- Bookmark
- Subscribe
- Mute
- Subscribe to RSS Feed
- Permalink
- Report Inappropriate Content
I think the expression isn't quite right. Because you applied an aggr() around the accumulation (there are complex scenarios in which an aggr() is needed but you shouldn't start with them) and they missed an outer-aggregation.
Therefore I suggest to play with the following:
RangeSum(Above(Sum([New Employees Count]), 0, RowNo(TOTAL)))
within the table-chart. If it worked there you could try to adapt it within the bar-chart.
- Mark as New
- Bookmark
- Subscribe
- Mute
- Subscribe to RSS Feed
- Permalink
- Report Inappropriate Content
@marcus_sommer Actually, I also started with this expression but it doesn't give proper results.
Without any 'Aggr', Result is:
If, I 'Aggr' only by Period, then result is as below; doesn't show department, even when it is added as Dimension. However the numbers are correct
With aggr on Department and period, is the one already added above:
Thanks in advance, with the help to get resolution.
- Mark as New
- Bookmark
- Subscribe
- Mute
- Subscribe to RSS Feed
- Permalink
- Report Inappropriate Content
Like above already hinted - the proper dimension-values are missing. If you want to show an aggregation-result against all included dimensions you will need also a dimension-value for each dimension-combination because against NULL nothing could be plotted. That's not specially related for accumulation-views else it's true for all kind of views.
Therefore I could only repeat my suggestion to populate missing records as well as missing values (replacing NULL with real values) to get such views. If there is no mandatory need for exact such view else only to show the relevant information, you could play with other objects and configuration (for example using a grouped view instead of a stacked one) and/or combining multiple objects, maybe by overlapping multiple views, like in the bar-chart above which displayed the right values (of course the missing ones are missing) and by replacing the scale with another chart it would display the truth.
- Mark as New
- Bookmark
- Subscribe
- Mute
- Subscribe to RSS Feed
- Permalink
- Report Inappropriate Content
@marcus_sommer This means the only way is to populate the dimension values if it is required to appear.
Thanks for this discussion.


