Unlock a world of possibilities! Login now and discover the exclusive benefits awaiting you.
- Qlik Community
- :
- All Forums
- :
- QlikView App Dev
- :
- Multigauge
- Subscribe to RSS Feed
- Mark Topic as New
- Mark Topic as Read
- Float this Topic for Current User
- Bookmark
- Subscribe
- Mute
- Printer Friendly Page
- Mark as New
- Bookmark
- Subscribe
- Mute
- Subscribe to RSS Feed
- Permalink
- Report Inappropriate Content
Multigauge
Hello i need to understand how multy Gauge Graph works, but acting only on Transparency it doesn't work properly, any ideas?
Thanks
Marco
- Mark as New
- Bookmark
- Subscribe
- Mute
- Subscribe to RSS Feed
- Permalink
- Report Inappropriate Content
- Mark as New
- Bookmark
- Subscribe
- Mute
- Subscribe to RSS Feed
- Permalink
- Report Inappropriate Content
Hello Marco,
What exactly do you want to achieve?
Do you want to get 2 needles on a gauge? Smth like attached screen?
UPD: Add filled gauges screen.
Regards,
Andrei
- Mark as New
- Bookmark
- Subscribe
- Mute
- Subscribe to RSS Feed
- Permalink
- Report Inappropriate Content
The top gauge should have all chrome disabled (chrome=dash, tick marks, title bar, regions, etc.) and should have exactly the same Max/Min settings as the bottom one. Then align the needles. For example, this one is contructed from two gauges placed on top of each other:
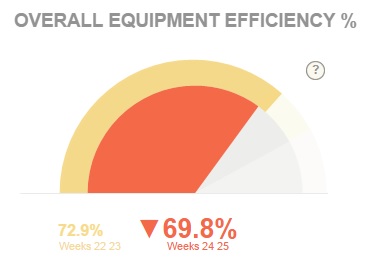
See Qlik OEE Analysis demo @ eu-a.demo.qlik.com/QvAJAXZfc/opendoc.htm?document=qvdocs%2FOEE.qvw&host=demo11 (sorry, link edited to avoid moderation. Copy in your browsers address bar.)
- Mark as New
- Bookmark
- Subscribe
- Mute
- Subscribe to RSS Feed
- Permalink
- Report Inappropriate Content
Yes i want to get two needles like the second gauge.
What are the main properties have i to set?
Thanks
Marco
- Mark as New
- Bookmark
- Subscribe
- Mute
- Subscribe to RSS Feed
- Permalink
- Report Inappropriate Content
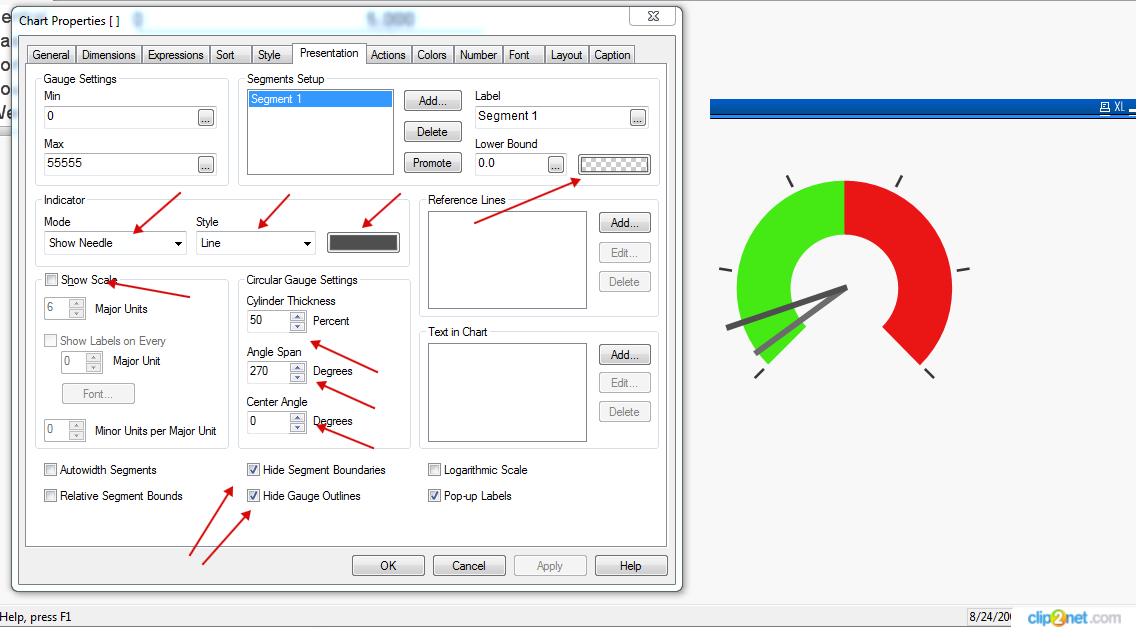
Please find attached examples.
In one of gauges I made transparent almost everything.
Check properties carefully. There are loads of options to play around
Hope this helps.
Regards,
Andrei
- Mark as New
- Bookmark
- Subscribe
- Mute
- Subscribe to RSS Feed
- Permalink
- Report Inappropriate Content
What are these load options, i can't find them.
Any screenshoots?
Marco
- Mark as New
- Bookmark
- Subscribe
- Mute
- Subscribe to RSS Feed
- Permalink
- Report Inappropriate Content
Ok, it seems to be the segment transparency.
Marco
- Mark as New
- Bookmark
- Subscribe
- Mute
- Subscribe to RSS Feed
- Permalink
- Report Inappropriate Content
All of these options can modify your Gauge significantly.
Just aply imagination 
Hope this helps.
Andrei