Unlock a world of possibilities! Login now and discover the exclusive benefits awaiting you.
- Qlik Community
- :
- All Forums
- :
- QlikView App Dev
- :
- Re: Multiple Colored Bars in Dual Axis Chart
- Subscribe to RSS Feed
- Mark Topic as New
- Mark Topic as Read
- Float this Topic for Current User
- Bookmark
- Subscribe
- Mute
- Printer Friendly Page
- Mark as New
- Bookmark
- Subscribe
- Mute
- Subscribe to RSS Feed
- Permalink
- Report Inappropriate Content
Multiple Colored Bars in Dual Axis Chart
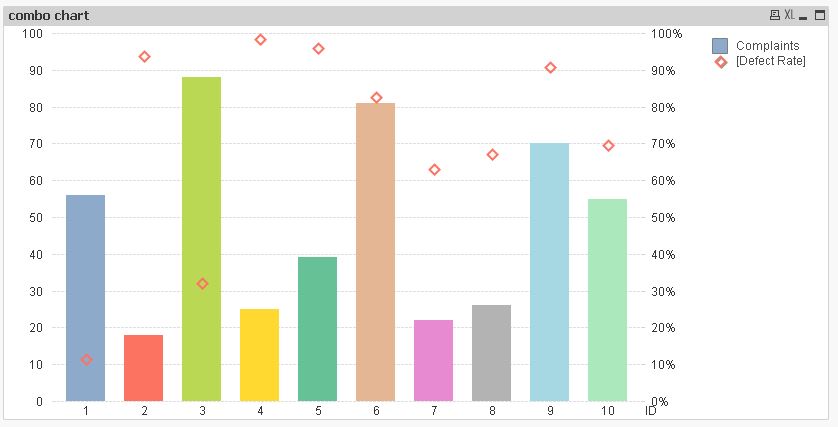
I have created a Chart that uses both Y-axes. Left axis is Complaints (bar chart) and Right axis is Defect Rate % (Diamonds). By using this feature I no longer have the ability to select "Mulitcolored" for the bars (they are all blue). I would like them to be multicolored.
I have created conditions in the past based on > or < certain % would be represented by a certain color, but the bar charts are based on numbers and I don't want them colored based on their number. Just random.
Does anyone know of an expression that will give each bar its own color?
Thanks.
Jeff
Accepted Solutions
- Mark as New
- Bookmark
- Subscribe
- Mute
- Subscribe to RSS Feed
- Permalink
- Report Inappropriate Content
Hi,
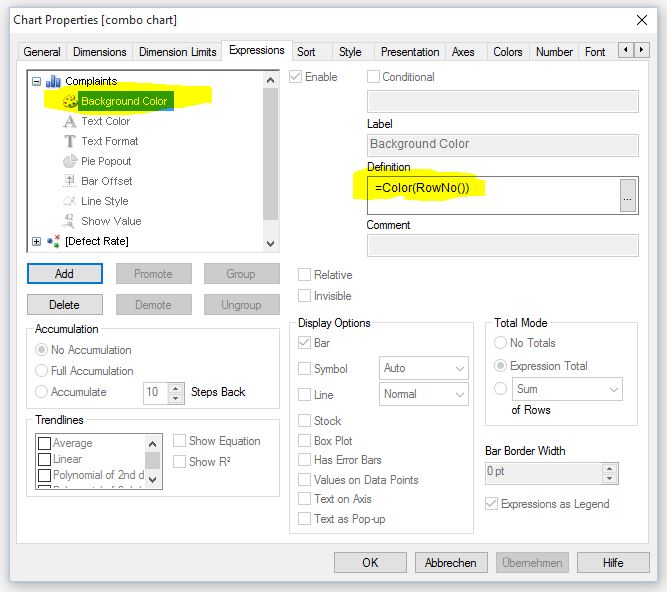
the reason for the "Multicolored" being greyed out is your two expressions rather than the separate axes.
To multicolor the bars you could use a background color expression like:
hope this helps
regards
Marco
- Mark as New
- Bookmark
- Subscribe
- Mute
- Subscribe to RSS Feed
- Permalink
- Report Inappropriate Content
Hi,
the reason for the "Multicolored" being greyed out is your two expressions rather than the separate axes.
To multicolor the bars you could use a background color expression like:
hope this helps
regards
Marco
- Mark as New
- Bookmark
- Subscribe
- Mute
- Subscribe to RSS Feed
- Permalink
- Report Inappropriate Content
Marco:
Worked like a charm!
Thanks so much.
Jeff