Unlock a world of possibilities! Login now and discover the exclusive benefits awaiting you.
- Qlik Community
- :
- All Forums
- :
- QlikView App Dev
- :
- Multiple Values on Data Points
- Subscribe to RSS Feed
- Mark Topic as New
- Mark Topic as Read
- Float this Topic for Current User
- Bookmark
- Subscribe
- Mute
- Printer Friendly Page
- Mark as New
- Bookmark
- Subscribe
- Mute
- Subscribe to RSS Feed
- Permalink
- Report Inappropriate Content
Multiple Values on Data Points
I'm trying to display an expression value on data points (not the value of the bar, but another calc) in my bar chart, so the bar shows the total sale amount by month, and the value at the top of the bar shows the average order total. There are 2 bars - one showing total gross sales and one showing total net sale amount, and i want the average of each to appear on top of each bar. But I can only get one to show, and it always shows above the 2nd bar. Is there a way to get both expression values to show?
See attached example
Accepted Solutions
- Mark as New
- Bookmark
- Subscribe
- Mute
- Subscribe to RSS Feed
- Permalink
- Report Inappropriate Content
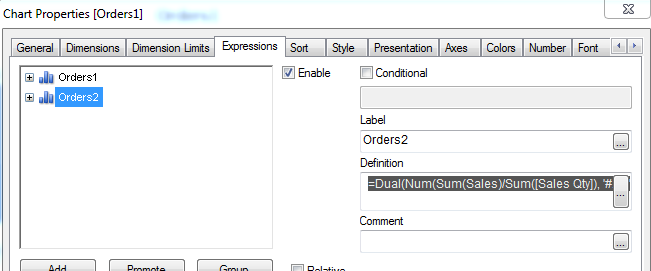
Is this what you are looking for?
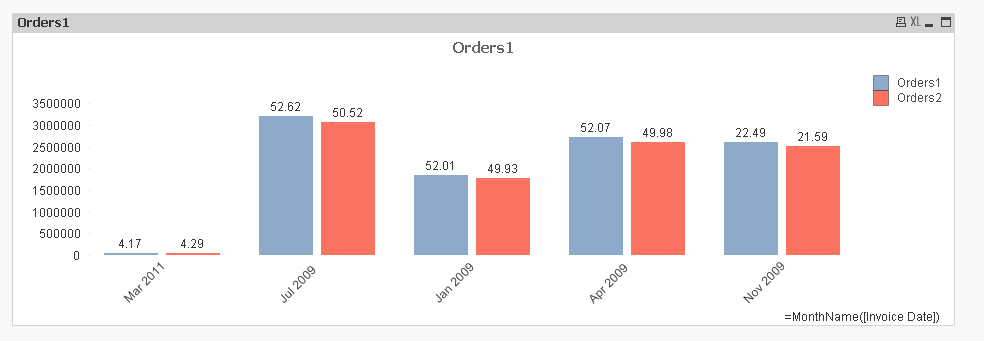
If yes then use these two expression (remove the two additional for just labels)
Exp1: =Dual(Num(Sum(GrossSales)/Sum([Sales Qty]), '#.00'), Sum(GrossSales))
Exp2: =Dual(Num(Sum(Sales)/Sum([Sales Qty]), '#.00'), Sum(Sales))
- Mark as New
- Bookmark
- Subscribe
- Mute
- Subscribe to RSS Feed
- Permalink
- Report Inappropriate Content
Is this what you are looking for?
If yes then use these two expression (remove the two additional for just labels)
Exp1: =Dual(Num(Sum(GrossSales)/Sum([Sales Qty]), '#.00'), Sum(GrossSales))
Exp2: =Dual(Num(Sum(Sales)/Sum([Sales Qty]), '#.00'), Sum(Sales))
- Mark as New
- Bookmark
- Subscribe
- Mute
- Subscribe to RSS Feed
- Permalink
- Report Inappropriate Content
Hello, Ashley!
See attach.
- Mark as New
- Bookmark
- Subscribe
- Mute
- Subscribe to RSS Feed
- Permalink
- Report Inappropriate Content
Yes, this did it. Thank you!
- Mark as New
- Bookmark
- Subscribe
- Mute
- Subscribe to RSS Feed
- Permalink
- Report Inappropriate Content
Awesome 
I am glad it worked.
Best,
Sunny