Unlock a world of possibilities! Login now and discover the exclusive benefits awaiting you.
Announcements
April 13–15 - Dare to Unleash a New Professional You at Qlik Connect 2026: Register Now!
- Qlik Community
- :
- All Forums
- :
- QlikView App Dev
- :
- Multiple count
Options
- Subscribe to RSS Feed
- Mark Topic as New
- Mark Topic as Read
- Float this Topic for Current User
- Bookmark
- Subscribe
- Mute
- Printer Friendly Page
Turn on suggestions
Auto-suggest helps you quickly narrow down your search results by suggesting possible matches as you type.
Showing results for
Not applicable
2017-04-03
01:01 PM
- Mark as New
- Bookmark
- Subscribe
- Mute
- Subscribe to RSS Feed
- Permalink
- Report Inappropriate Content
Multiple count
Hello,
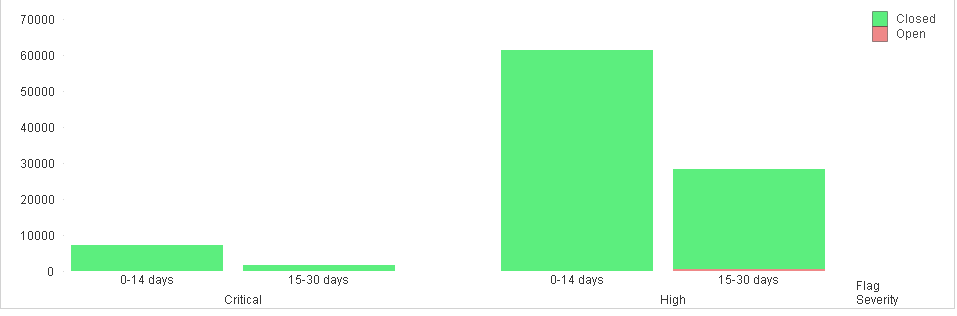
I'm trying to create a chart that shows the values opened and the values closed by the flag of 0-14 days and 15-30 days. right now it's showing total numbers, rather than within those time frames. below are my expressions:
open: count({<Flag={'0-14 days','15-30 days'},Severity={'Critical', 'High'}>} First_Discovered
Closed: count({<Flag={'0-14 days','15-30 days'},Severity={'Critical', 'High'}>} Closed_On)
Dimension: Severity and Flag
It seems to be counting total first discovered and total closed on.
268 Views
1 Reply
MVP
2017-04-03
01:27 PM
- Mark as New
- Bookmark
- Subscribe
- Mute
- Subscribe to RSS Feed
- Permalink
- Report Inappropriate Content
If you have used Flag and Severity as dimensions, just change the order of them.. otherwise provide sample data.
220 Views